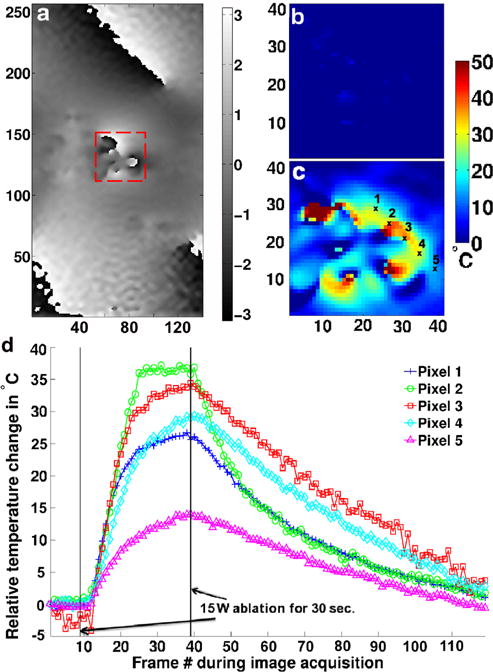
FIG. 3.

Limited FOV temperature measurement in a stationary agar phantom. a: Reference phase image in the plane centered at the catheter tip and perpendicular to the catheter shaft direction; temperature maps prior to the start of RF ablation (b) and at the end of the ablation (c) over the dashed line box in (a) using the Referenced calculation method; d: single pixel temperature evolution plots for five different pixels indicated in (c) before, during, and after ablation using the Referenced calculation method. To avoid any correlation caused by the zero-filling interpolation, the measurements are spaced every four pixels. [Color figure can be viewed in the online issue, which is available at wileyonlinelibrary.com.]
