
FIG. 4.
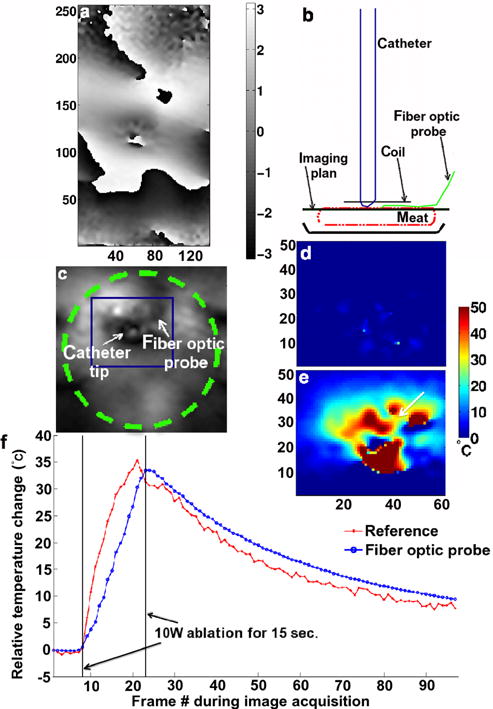
Limited FOV temperature measurements in a stationary meat phantom. a: Reference phase image obtained with the segmented echo-planar imaging sequence in the plane perpendicular to the catheter shaft and centered at the catheter tip; b: schematic of the experimental setup and image plane selection; c: magnified magnitude image. The dashed line circle in (c) represents the local coil. The dark square in (c) indicates where the temperature maps in (d) and (e) were derived. Magnified temperature maps, in the same orientation as in (c), determined using the Referenced calculation method prior to the start of the RF ablation (d) and at the end of the RF ablation (e); f: temperature evolution over time in one pixel in the ablation lesion next to the fiber optic probe [1 mm, arrow tip in (e)] using the Referenced MR thermometry methods and the fiber optic temperature relative recordings. The large fluctuations between the pixels in the near field of the catheter tip are the results of magnetic susceptibility artifact. [Color figure can be viewed in the online issue, which is available at wileyonlinelibrary.com.]