
FIG. 5.
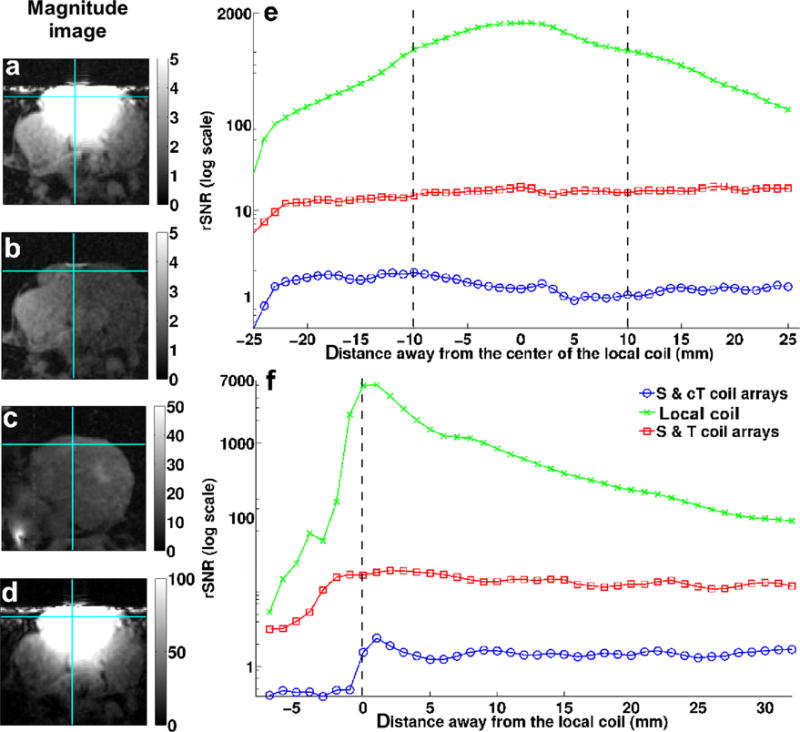
In vivo SNR map and profiles from an axial view. Magnified images acquired using: (a) the spine coil, the custom-made torso array, and the local coil; (b) the spine and custom-made torso arrays (S & cT); (c) the spine and torso coil arrays (S & T); and (d) the local coil; SNR profiles through the images (b), (c), and (d) along the horizontal solid line (e) and along the vertical solid line (f). The black vertical dash lines represent the coil’s location on both (e) and (f). The original FOV for these images was 192 × 192 mm2. [Color figure can be viewed in the online issue, which is available at wileyonlinelibrary.com.]