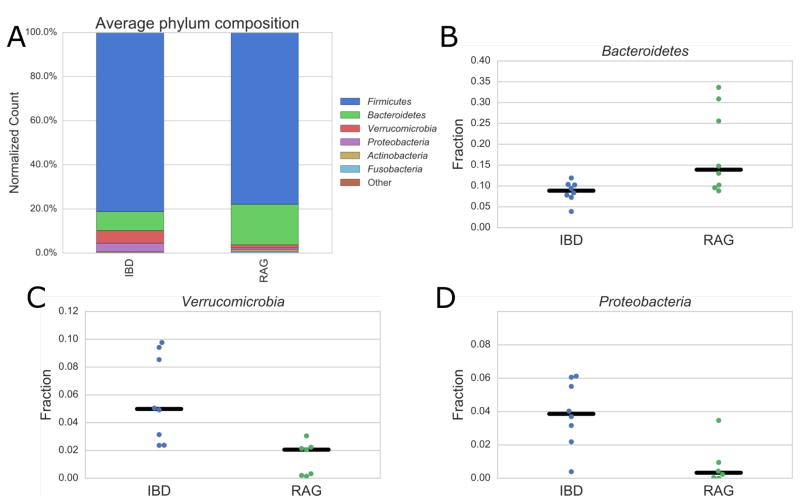
Figure 3.
Plots pertaining to taxonomic analysis. Bar plot (A) of averaged peptide spectral counts attributable to a single phylum obtained from LC-MS/MS-based metaproteomics of RAG−/− control versus IBD mice. (B–D) Plots showing the levels of spectral counts attributable to a single phylum in each individual experimental replicate. The phyla shown were found to be significantly different (p < .05) via t-test. The phyla Verrucomicrobia in panel C and Proteobacteria in panel D reached significance levels of (p < .01).

