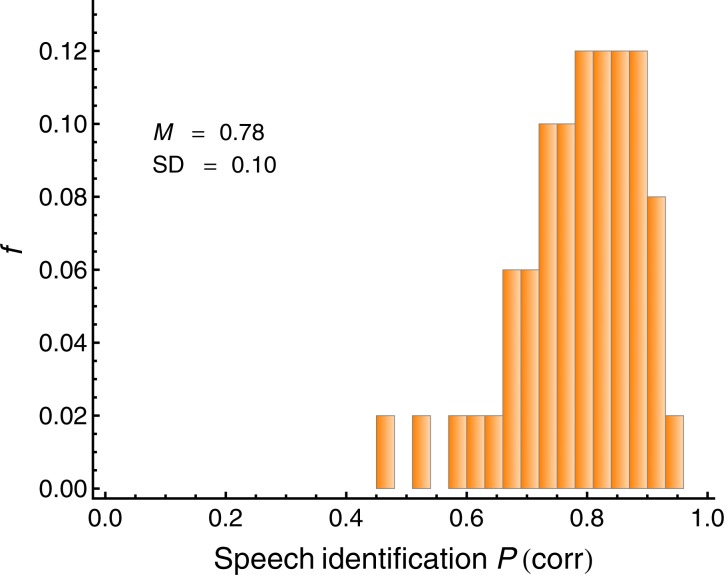
Figure 2. Average individual proportion correct (speech recognition score; SRS) in the simulated cocktail-party listening task with two spatially separated interfering speakers (N = 50).
This measure served as the criterion variable in the regression analyses. The mean (M) and the standard deviation (SD) are displayed.

