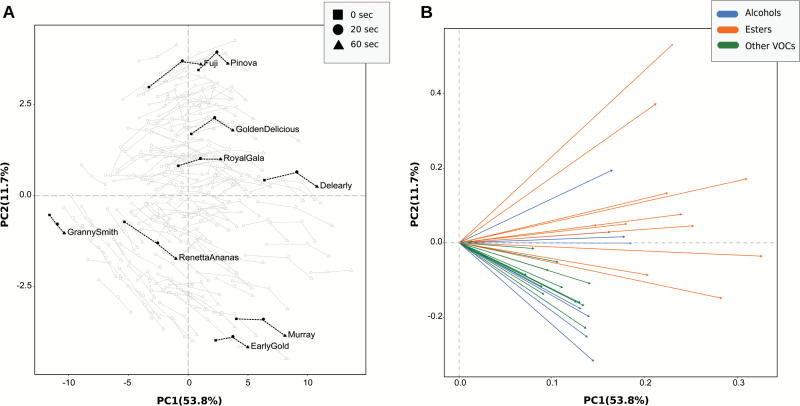
Fig. 2.
Principal component analysis (PCA) plot (A) and loading projection (B) of the VOC distribution assessed by PTR-ToF-MS during the artificial chewing. The plot in (A) depicts the VOC profile distribution of the apple cultivars over the PCA score plot defined by the first two principal components. Within the germplasm collection, nine cultivars were arbitrarily highlighted (‘Delearly’, ‘Early Gold’, ‘Fuji’, ‘Golden Delicious’, ‘Granny Smith’, ‘Murray’, ‘Pinova’, ‘Renetta Ananas’, and ‘Royal Gala’). Different symbols (square, circle, and triangle) indicate the time of assessment during the artificial chewing (0, 20, and 60 s after chewing). Each data point is the average of five biological replicates. The plot in (B) shows the projection of the 33 significant VOC mass peaks reported using different colors according to the chemical family. The mass peak identity is reported in Supplementary Fig. S2.

