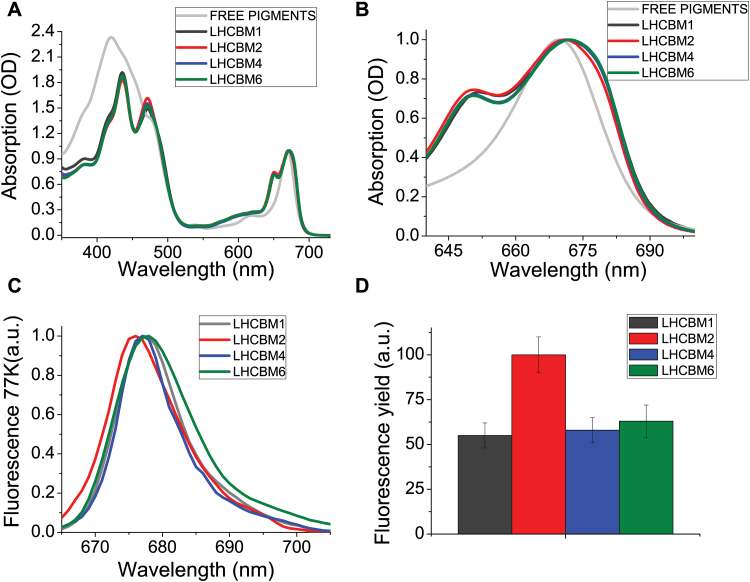
Fig. 2.
Absorption spectra and fluorescence yield of LHCBM1, LHCBM2, LHCBM4, and LHCBM6 recombinant proteins. (A) Absorption spectra in the 350–750 nm range normalized to the maximum peak in the Qy region. (B) Absorption spectra of LHCBM complexes zoomed in the 630–700 nm range. (C) 77K fluorescence emission spectra of LHCBM complexes upon excitation at 440 nm. (D) Relative fluorescence quantum yield of LHCBM1, LHCBM4, and LHCBM6 compared with LHCBM2, set to 100%. SDs are reported for each sample (n=5).

