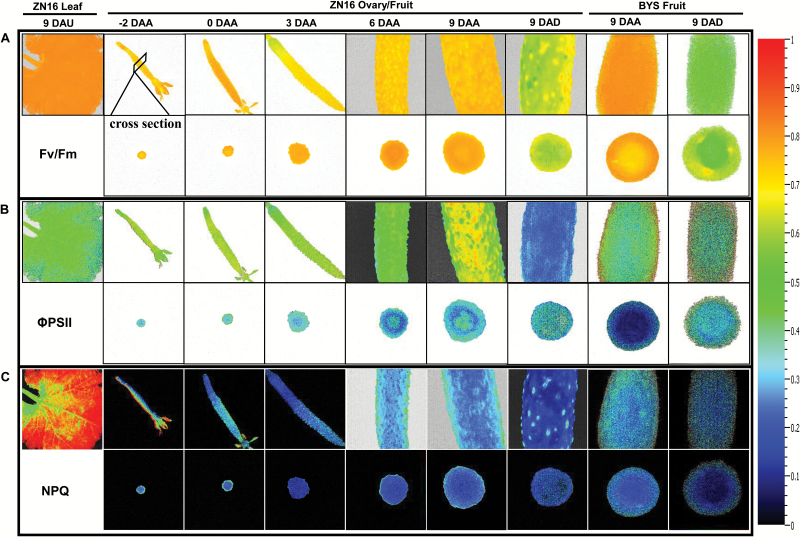
Fig. 6.
Chlorophyll fluorescence imaging of cucumber fruits. (A–C) Fluorescence images correspond to Fv/Fm (A), ΦPSII (B), and NPQ (C). The upper row shows images of the whole or partial fruits; in the lower row are the corresponding cross-sections. All images were normalized to a false color bar (see right column). The pixel value display is based on a false-color scale ranging from blue (0.0), green, yellow, to red (ending at 1.0). The analyses of Fv/Fm were carried out on dark-adapted fruits and leaves, while those of ΦPSII and NPQ were at a light intensity of 500 μmol quanta m–2 s–1. Fv/Fm, maximum PSII quantum yield; ΦPSII, steady-state PSII quantum yield; NPQ, steady-state non-photochemical quenching.

