Fig. 7.
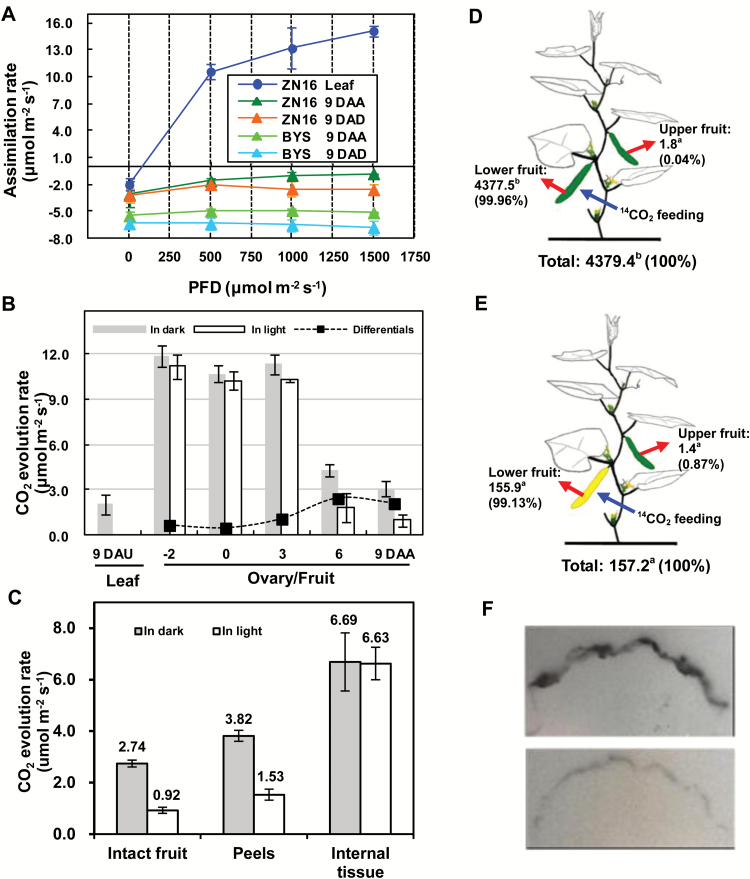
CO2 assimilation and 14C feeding in cucumber fruits. (A) The response curve of assimilation rate to photon flux density (PFD). (B) CO2 evolution rate of exocarp (peels) in the dark and illuminated (1000 µmol quanta m–2 s–1 irradiance) conditions during ‘ZN16’ fruit development. The net photosynthetic rate per unit fruit surface area (black squares) was the difference between the CO2 evolution rates in the light and dark. All data above were determined at ambient CO2 between 390 mbar and 410 mbar and at air temperature of 28°C. (C) CO2 evolution rate of intact fruit, peels, and internal tissue under dark and light (1000 µmol quanta m–2 s–1 irradiance) conditions, respectively (Variety ‘ZN16’, 9 DAA). Error bars represent the SD, n=3. (D, E) Allocation of 14C in cucumber fruits. Lower non-bagged (D) or bagged (E) fruits were fed with 3.7 × 10⁶ Bq 14CO2 (blue arrows). After 24 h, specific activities (Bq g–1 DW) of lower and upper fruits (red arrows) were determined. The means (n=3) followed by different letters indicate statistically significant differences according to Tukey’s test (P<0.05). Values in parentheses are percentages of the total measurements. (F) 14C autoradiograph of non-darkened fruit (upper photo) and darkened fruit (lower photo) at 1 h after the ending of 14CO2 feeding.

