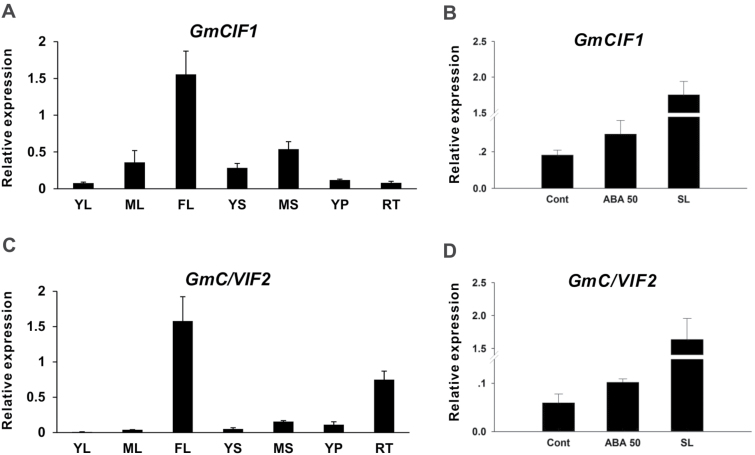
Fig. 3.
Expression analyses of GmCIF1 and GmC/VIF2. (A, C) Transcript levels of GmCIF1 and GmC/VIF2 in different soybean tissues. (B, D) Expression of GmCIF1 and GmC/VIF2 in response to ABA and ABA-triggered leaf senescence. Data represent mean values ±SE of at least three independent biological replicates for qRT-PCR. GmACT2/7, GmACTII, GmEF/αb, and GmCYP were used as reference genes. YL, young leaf; ML, mature leaf; FL, flower; YS, seed 15 d after flowering (DAF); MS, seed 25 DAF; YP, young pods 10 DAF; RT, root; Cont, control; ABA 50, 50 µM ABA; SL, senescent leaves induced with 200 µM ABA.

