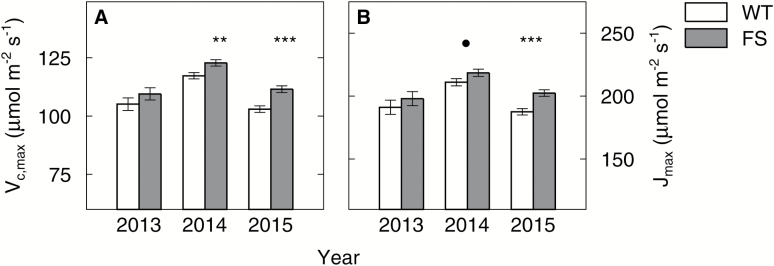
Fig. 4.
Mean Vc,max and Jmax of the wild-type (WT) and bifunctional FBP/SBPase-expressing (FS) plants in comparison. Vc,max (A) and Jmax (B) were derived from A–Ci curves conducted at a leaf temperature of 25 °C and the data were pooled for all four treatments (ambient/elevated CO2, control/heated plots) and for all sampling days in the respective years. Error bars are ±SE of the LS means estimate as derived from a repeated measures ANOVA. Symbols mark significant differences between the WT (empty bars) and FS (gray bars) (• <0.1, ** <0.01 *** <0.001). Note that the y-axis does not start at zero.

