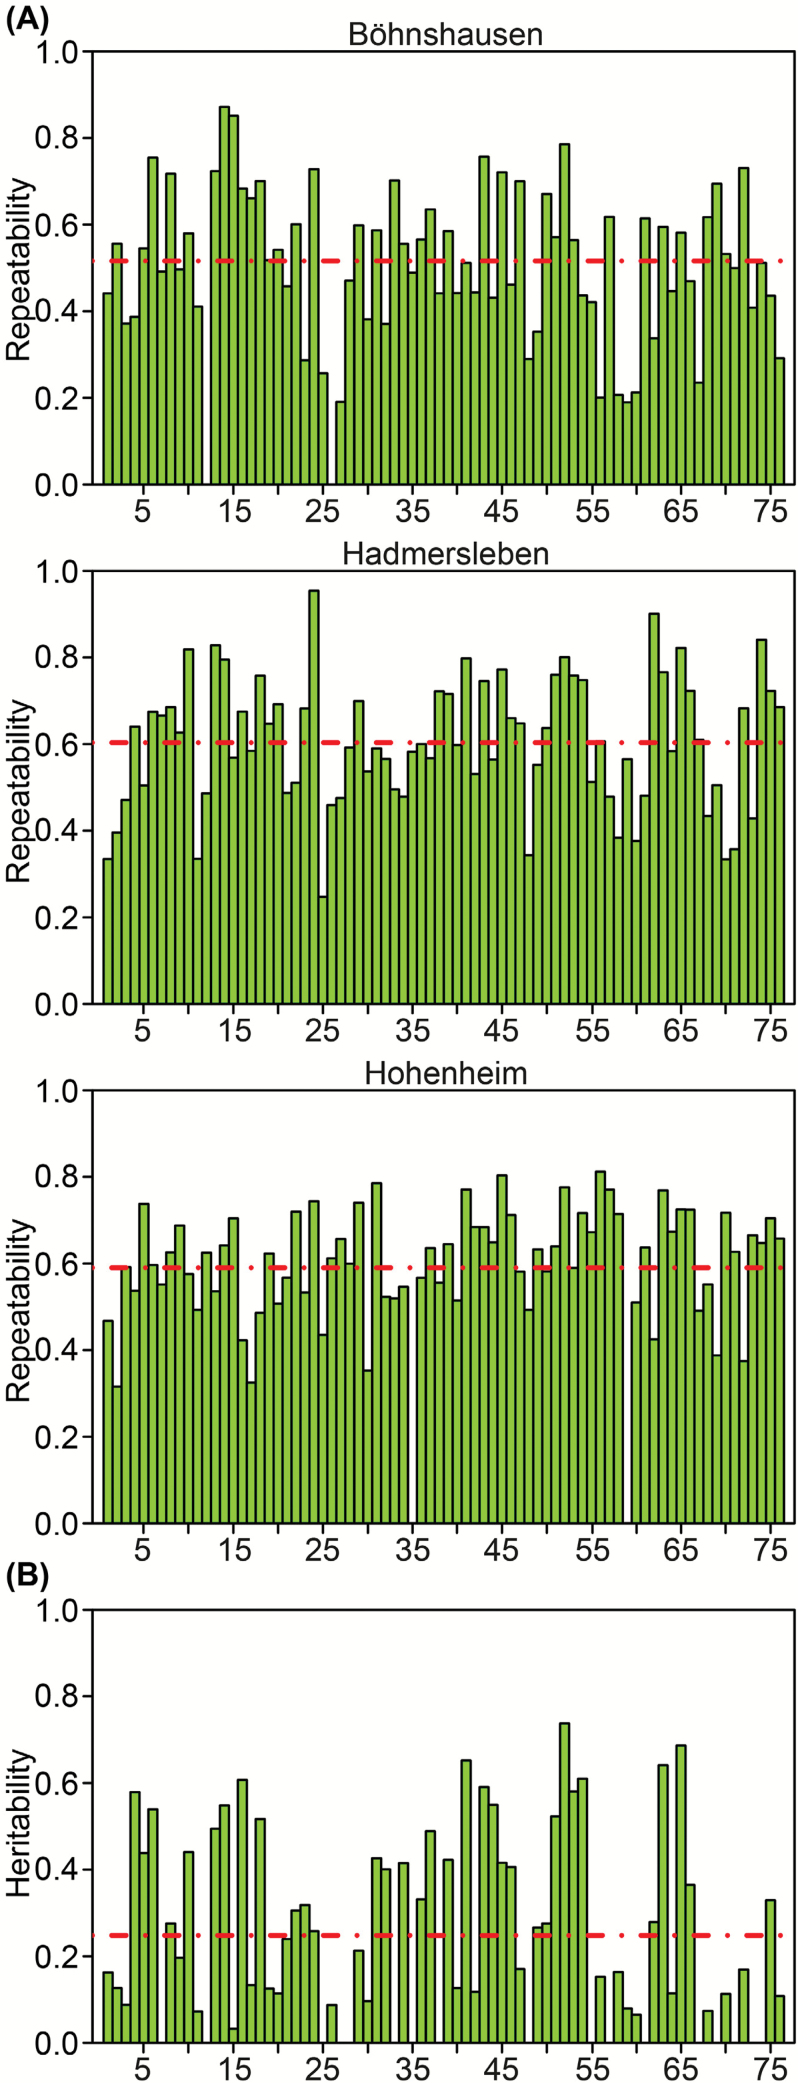
Fig. 1.
(A) Reproducibility of metabolite abundances across the three field sites. The mean values, with 0.52 for Böhnshausen, 0.60 for Hadmersleben, and 0.59 for Hohenheim are indicated as dashed lines. (B) The heritability of abundance of the 76 metabolites across the three locations Hadmersleben, Böhnshausen, and Hohenheim. The mean value (0.25) is indicated as a dashed line.

