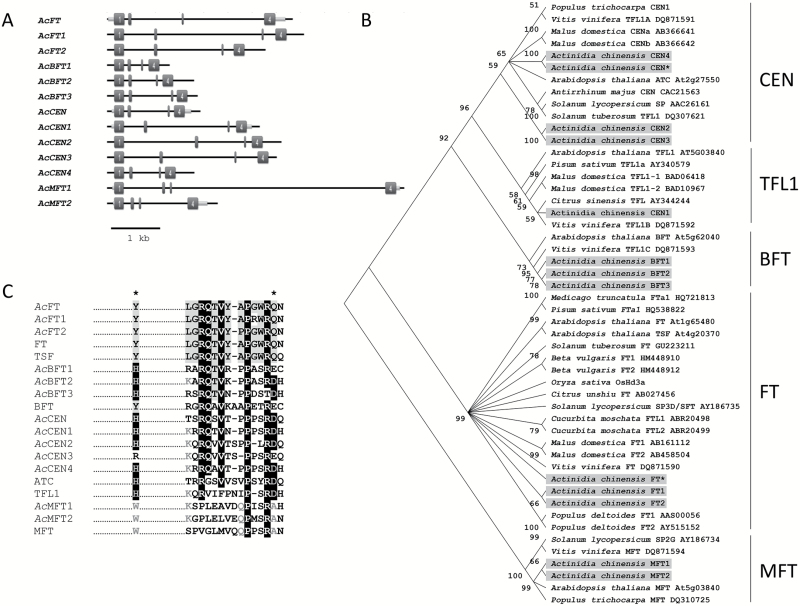
Fig. 1.
The Actinidia PEBP gene family. (A) Genomic organization of the genes. Dark gray boxes represent exons and light gray boxes represent untranslated region sequences (where available, based on RNA database searches). (B) Phylogram of plant PEBP proteins. The kiwifruit proteins are highlighted and previously described AcFT and AcCEN are indicated with an asterisk. (C) Partial amino acid alignment of Actinidia (Ac) and Arabidopsis PEBP proteins including the conserved segment B region.. Asterisks indicate Tyr85 (Y)/His88 (H) and Gln140 (Q)/Asp144 (D) residues distinguishing FT-like and TFL1-like members.

