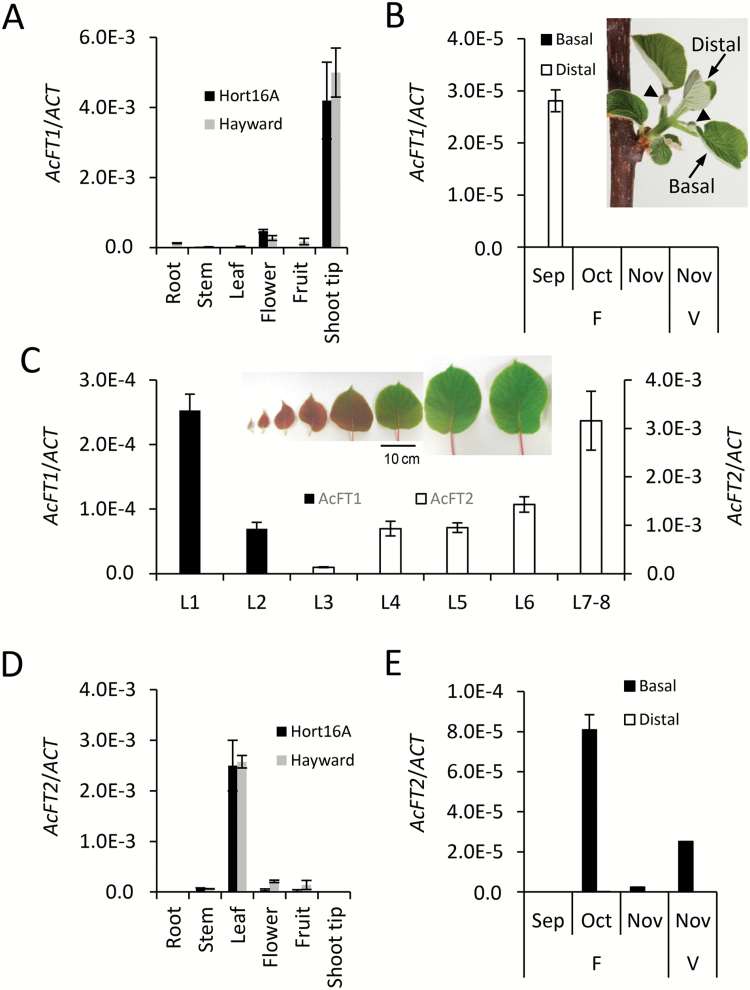
Fig. 5.
Expression patterns of AcFT1 and AcFT2 genes. (A) Relative AcFT1 expression ±SE in A. chinensis ‘Hort16A’ (black rectangles) and A. deliciosa ‘Hayward’ (gray rectangles) tissues, normalized against ACTIN. (B) Relative AcFT1 expression in basal and distal leaves of an A. chinensis ‘Hort16A’ growing shoots bearing developing flowers (F) and vegetative shoots (V) during the spring months. The insert shows morphology of a typical A. chinensis shoot in September. (C) Relative expression of AcFT1 and AcFT2 in the leaves of fast growing shoots collected from juvenile glasshouse-grown plants. The insert denotes L1–L8 leaf morphology. Because of the small size of L1 and L2 leaves, leaves collected from single shoots from three plants were pooled for RNA extraction. Another replicate of leaves from three single shoots is presented in Supplementary Fig. S2. (D) Relative AcFT2 expression ±SE in A. chinensis ‘Hort16A’ (black rectangles) and A. deliciosa ‘Hayward’ (gray rectangles) tissues, normalized against ACTIN. (E) Relative AcFT2 expression in basal and distal leaves of A. chinensis ‘Hort16A’ growing shoots bearing flowers (F) and vegetative shoots (V) during spring months. All sampling was performed at mid-day from at least three plants and the expression was normalized against ACTIN.

