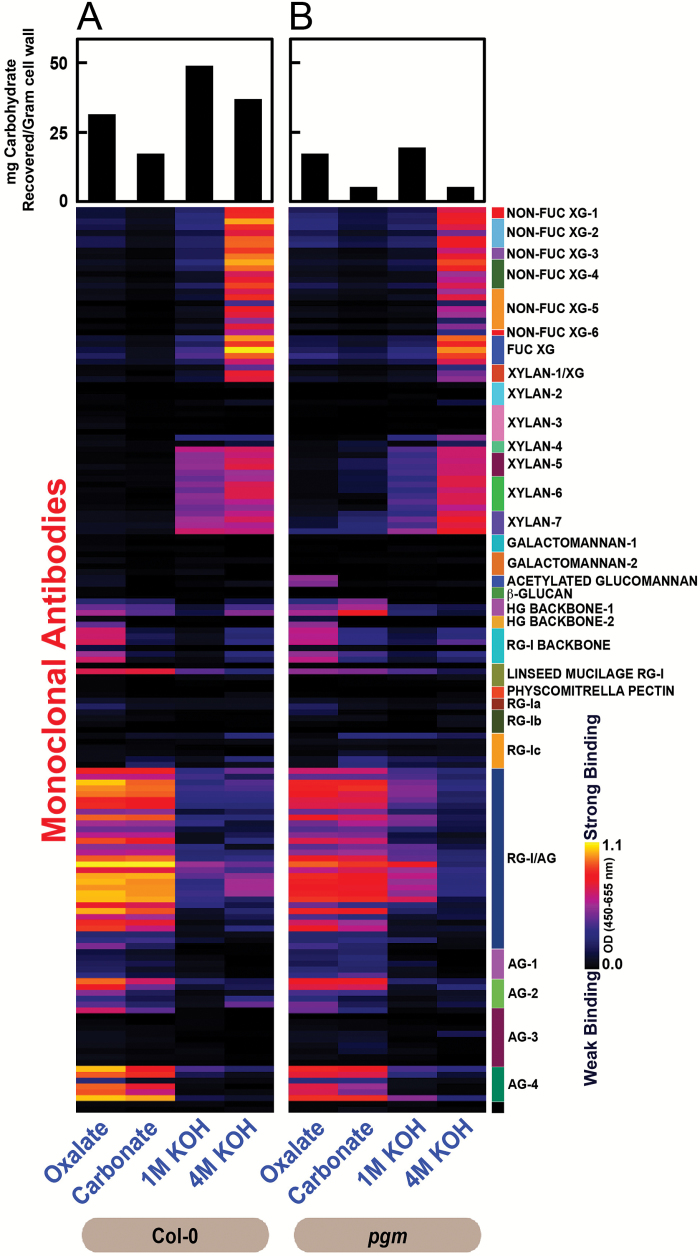
Fig. 5.
Glycome profiling of pgm mutants. Glycome profiling of sequential cell wall extracts prepared from rosette leaves of 5-week-old Col-0 (A) and pgm (B) plants. Samples represent pools of more than 50 fully expanded leaves collected in three independent experiments. Bar charts above the heat maps indicate the amount of carbohydrates recovered from cell wall preparations by sequential extraction with oxalate, carbonate, 1 M KOH and 4 M KOH. Extracts were analysed for abundance of cell wall glycan epitopes using 155 monoclonal antibodies (see Supplementary Table S1 and http://www.wallmabdb.net for details) whose glycan specificities are depicted on the right had side key. ELISA responses are illustrated in heat maps showing the relative binding strength of specific antibodies on a multi-color scale ranging from black (no binding) to bright yellow (strongest binding).

