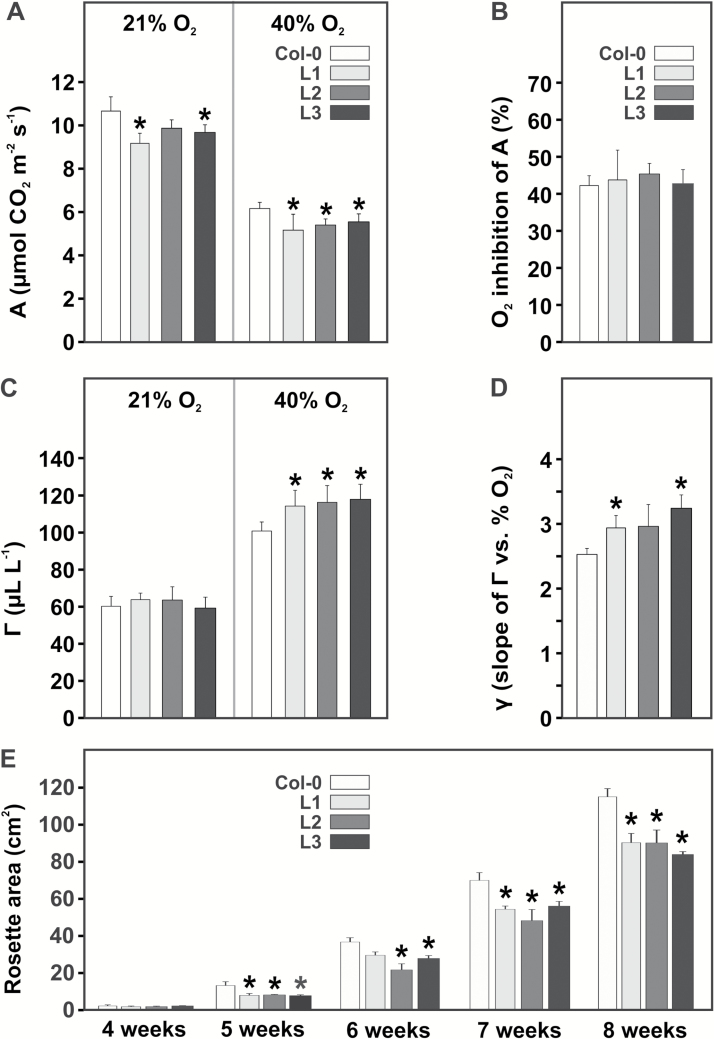
Fig. 3.
Photosynthetic parameters of SGAT overexpressor leaves at growth stage 5.1 and growth over 8 weeks. (A) Net CO2 uptake rates (A) at 390 µL L–1 CO2, 21% and 40% O2. (B) CO2 compensation points Γ at 21% and 40% oxygen. (C) Oxygen inhibition of A and (D) oxygen response of Γ (γ). Values for A–D are means±SD from at least four biological replicates. Asterisks indicate significant differences from the wild type based on Student’s t-test (P<0.05; n.s., not significant). (E) Leaf areas at five time points after germination. Values given are means±SD (n = 6). Asterisks indicate significant differences from the wild type at the respective time point based on Student’s t-test (*P<0.05).

