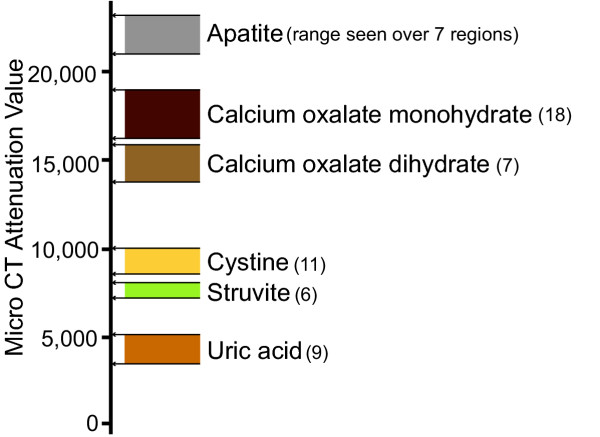
Figure 3.
Micro CT attenuation values taken from pure mineral regions identified by FT-IR microspectroscopy. Regions-of-interest representing pure mineral, confirmed by FT-IR mapping, were drawn on micro CT images collected just beneath the cut surface of stone slice, and average value for CT attenuation (in machine-specific units) was recorded. Horizontal lines indicate minimum and maximum values, and number of regions-of-interest indicated in parentheses. Note that each mineral composition is associated with non-overlapping attenuation values (uric acid 3515 – 4995, struvite 7242 – 7969, cystine 8619 – 9921, calcium oxalate dihydrate 13815 – 15797, calcium oxalate monohydrate 16297 – 18449, and hydroxyapatite 21144 – 23121).

