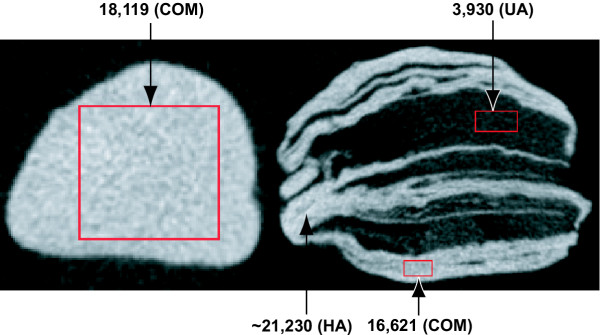
Figure 4.
Example of micro CT identification of mineral composition. Visually, there appears to be only one mineral contained in the stone in the left panel and three different minerals that comprise the stone in the right panel. Micro CT attenuation identified the left stone as pure COM, and the right stone as a mixture of hydroxyapatite (bright white, highest attenuation), COM (gray) and uric acid (close to black). Speckled nature of colors – particularly apparent in image at left – is due to image noise as a result of increased magnification.

