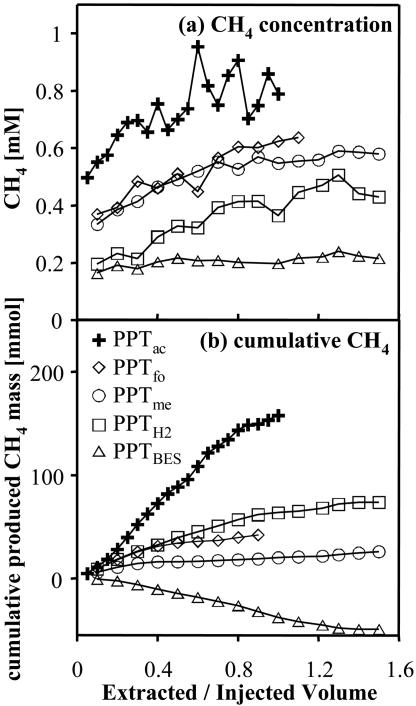
FIG. 2.
(a) Methane concentrations during extraction phases of five PPTs. Methane data represent the averages of two samples each. (b) Cumulative produced CH4 during extraction phases of five PPTs. Note that the time scales for the PPTs were different (Table 1). The extracted/injected volume is the volume pumped during the extraction phase divided by the total injected volume.

