Figure 2.


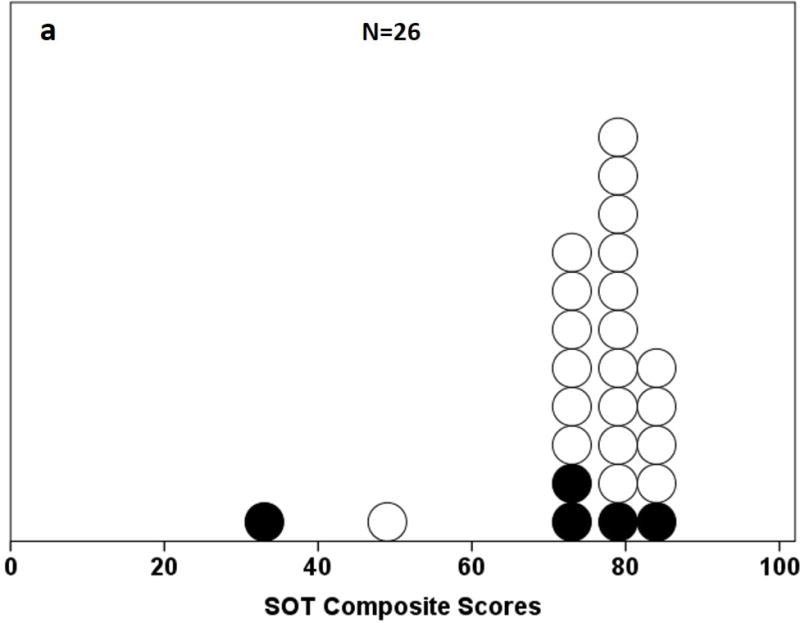
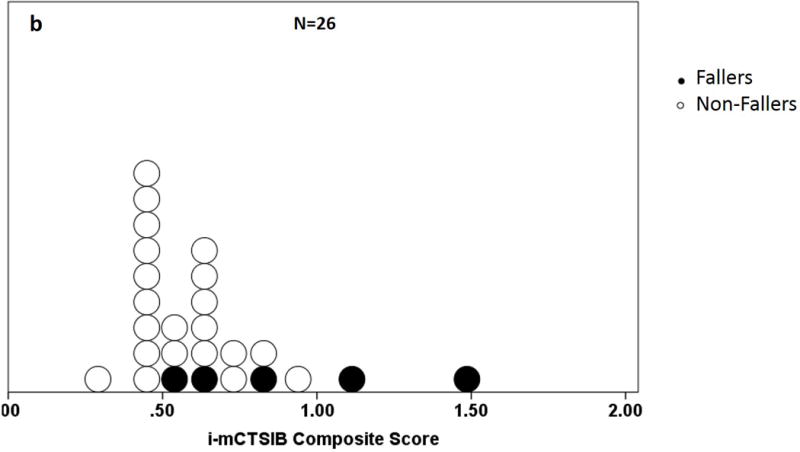
a and b. Distribution of composite scores on the a) Sensory Organization Test (SOT) and b) instrumented modified Clinical Test for the Sensory Interaction on Balance (i-mCTSIB). Shaded dots represent fallers.
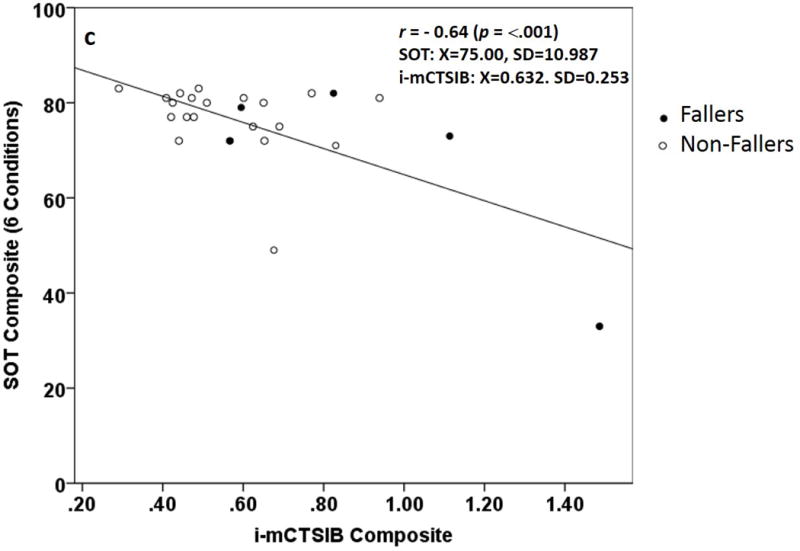
c. instrumented modified Clinical Test for the Sensory Interaction on Balance (i-mCTSIB) and Sensory Organization Test (SOT) Composite score scatterplot using accelerometer data in anterior-posterior (AP). Values for Pearson (r) correlation, mean, and standard deviation are shown. Shaded dots represent fallers.
