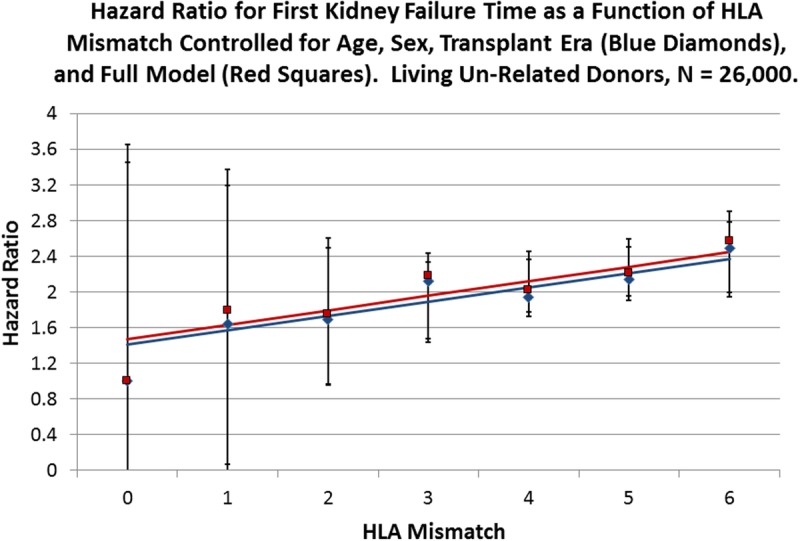
FIGURE 3.

Cox multivariate regressions were performed with the survival time of kidney allografts from LU donors as the dependent variable and HLA mismatch as the primary explanatory variable with 0 mismatch as the reference. Blue diamonds represent the observed HRs for HLA mismatch for a reduced model with age, sex, and transplant era as covariates (Table S5, SDC, http://links.lww.com/TXD/A36), whereas the red squares represent the observed HR values for the full model (Table 2). The solid blue line is the fitted line for the reduced model with an intercept of 1.41 (0.84-1.98; P = 0.0014) and a slope of 0.16 (0.04-0.28; P = 0.0213), whereas the red line is fitted to the full model observed values with an intercept of 1.47 (0.90-2.03; P = 0.0011) and a slope of 0.16 (0.04-0.29; P = 0.0194). Error bars are the 95% CI for the respective points on the fitted lines.
