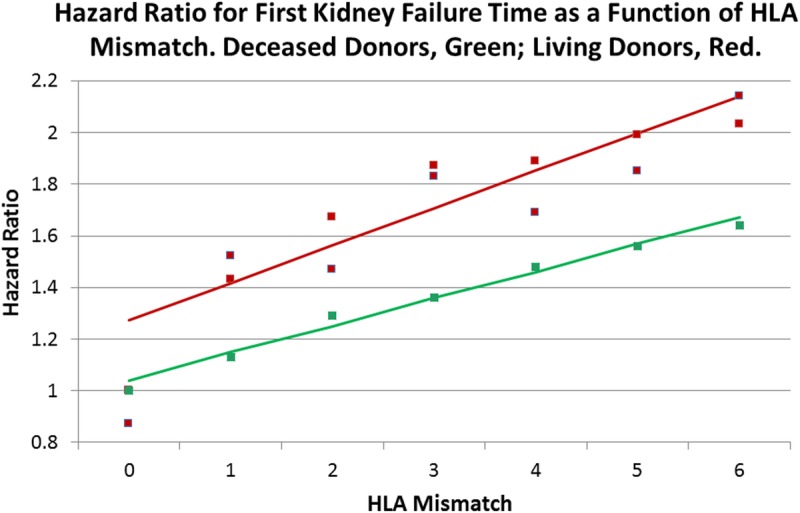
FIGURE 5.

A weighted regression line (red) was fitted to the HRs (red squares) in Table 4, a categorical variable that was constructed to combine the relatedness strata with HLA mismatch. The predicted line has an intercept of 1.27 (1.07-1.47; P <0.0001) and a slope of 0.14 (0.09-0.20; P < 0.0001). This slope is similar to the fully adjusted line of Figure 1 for all living donors and lies above the line for deceased donors, as previously described.10 Therefore, there is a higher penalty in kidney failure time for each HLA mismatch for a living donor as opposed to an organ from a deceased donor.
