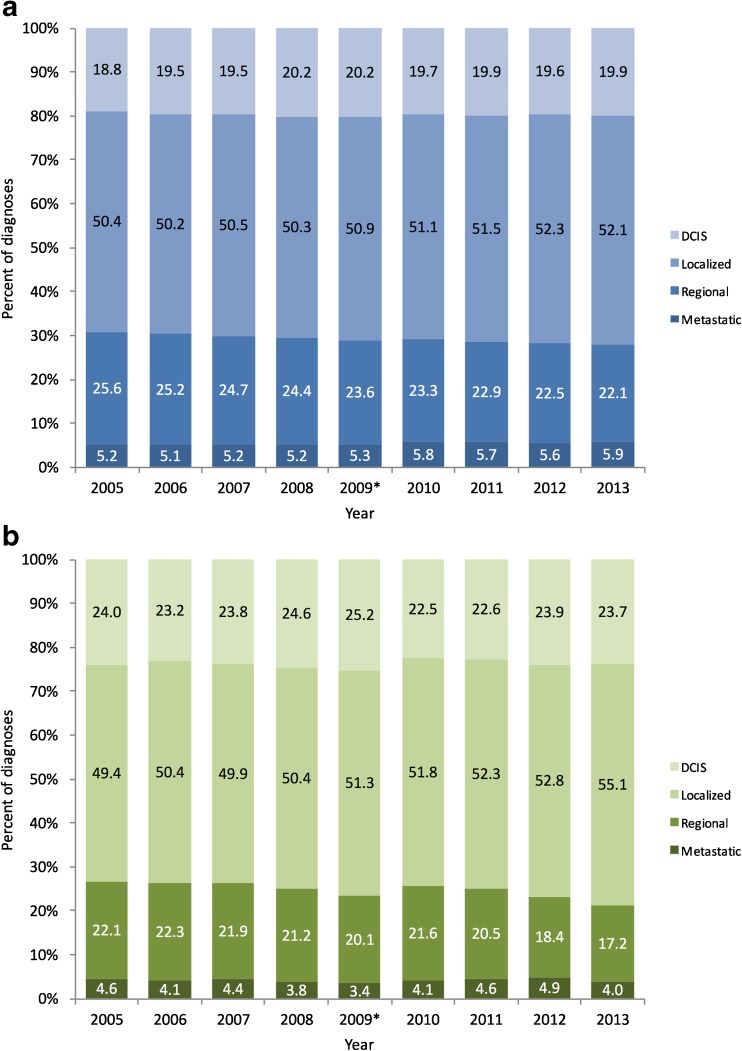
Figure 1.
Stage at diagnosis among women in Connecticut and control states. Panel A depicts the distribution of stage at diagnosis among women ages 40–74 with breast cancer in control states. Panel B depicts the distribution of stage at diagnosis among women ages 40–74 with breast cancer in Connecticut. *Breast density notification legislation was enacted in October of 2009.

