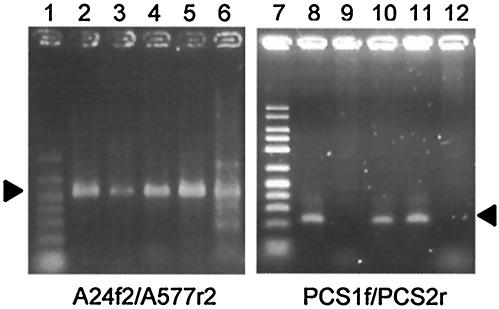
FIG. 3.
PCR amplification of HAE1 (lanes 2 to 6) and PCS (lanes 8 to 12) fragments from the soil DNA samples. The soil DNA samples included SC (lanes 2 and 8), SN (lanes 3 and 9), TH (lanes 4 and 10), SS (lane 5 and 11), and KM (lanes 6 and 12). Lanes 1 and 7 show molecular size markers (50 to 1,000 and 50 to 2,500 bp, respectively [FMC Bioproducts]). The positions of the expected HAE1 and PCS fragments are indicated with arrowheads.

