
Fig. 2.
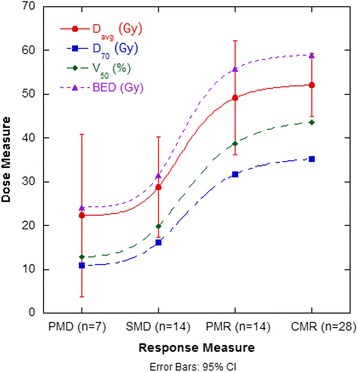
Dose curves for each category of response for Davg, D70, V50 and BED. Error bars represent the 95% CI for Davg
Official websites use .gov
A
.gov website belongs to an official
government organization in the United States.
Secure .gov websites use HTTPS
A lock (
) or https:// means you've safely
connected to the .gov website. Share sensitive
information only on official, secure websites.
Dose curves for each category of response for Davg, D70, V50 and BED. Error bars represent the 95% CI for Davg