
Fig. 3.
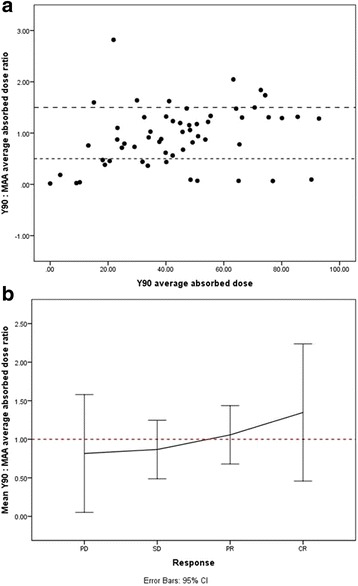
a The ratio of true (90Y) to predicted (MAA) mean absorbed dose across all lesions. Horizontal dashed lines represent a ±50% difference. An outlier with a ratio value of 12.3 was excluded for visual purposes. b The mean ratio of true (90Y) to predicted (MAA) lesion absorbed dose for each response category. Dashed line represents a ratio of 1.0