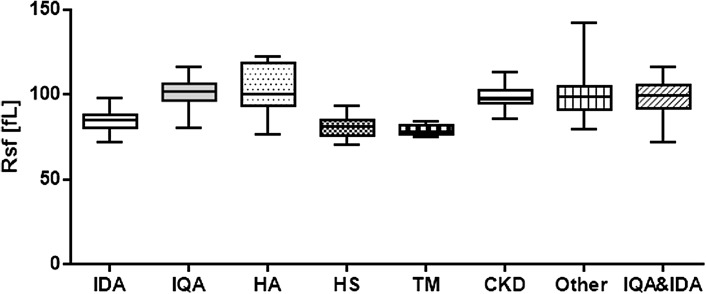
Fig. 3.
Box and whisker plot showing red blood cell size factor (Rsf) distribution in studied groups of anemia patients. The horizontal line in the center of the box shows the median value, and the whiskers show the minimum and maximum values for each group. IDA iron deficiency anemia, IQA anemia of the first quarter of life, HA hemolytic anemia, HS hereditary spherocytosis, TM thalassemia minor, CKD chronic kidney disease

