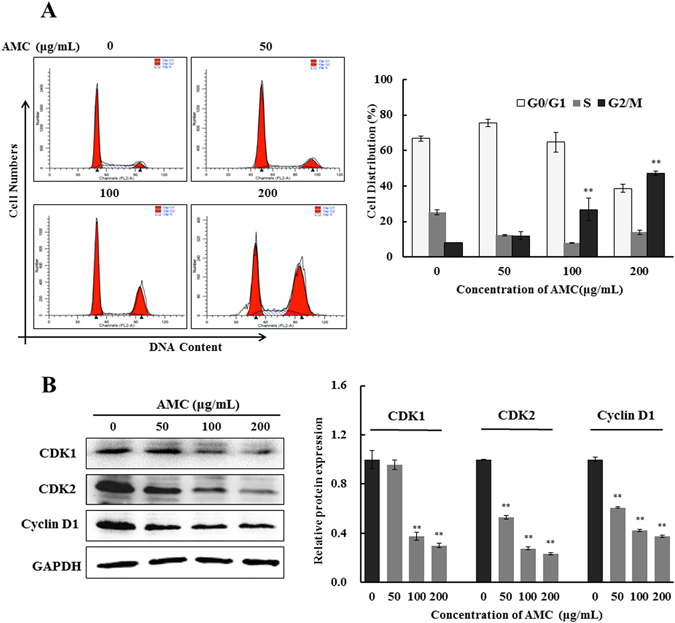
Figure 5.

Effect of AMC on cell cycle arrest of HepG2 cells. Representative flow cytomeric analysis for the DNA content in HepG2 cells treated with AMC at different concentrations of 50 μg/mL, 100 μg/mL, and 200 μg/mL. Cell cycle distribution and cell number percentage in each phase (G0/G1, S, and G2/M) were detected and calculated (A). The protein expression of CDK1, CDK2, and Cyclin D1 were analyzed by western blot (B). Values were presented as mean ± SD for at least three independent experiments performed in triplicate. *p < 0.05 and **p < 0.01 versus the control group.
