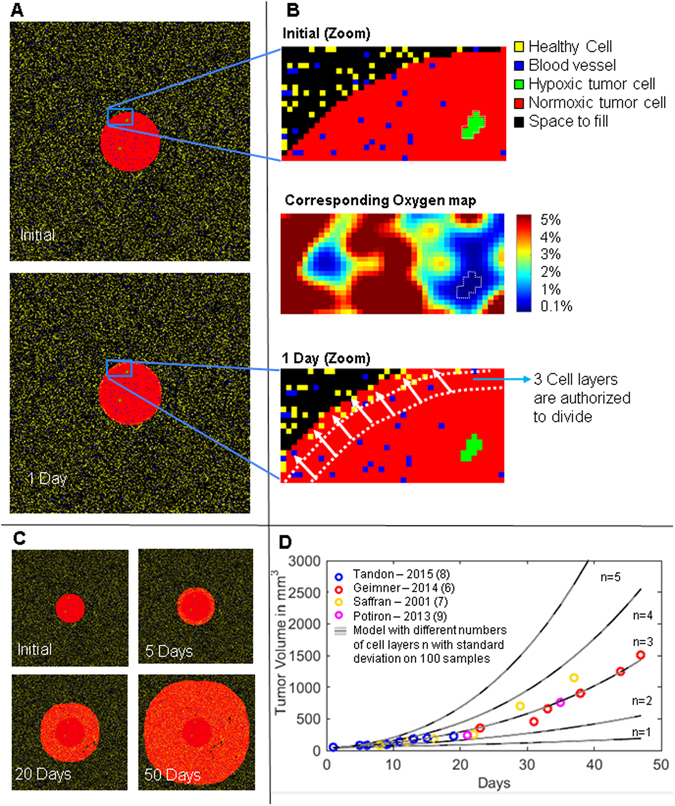
Figure 1.

Tumour Growth Model. (A) Automata model of the tumour at day 0 and 1 day later, i.e. one cell cycle later. (B) Each pixel corresponds to a tumour and endothelial cell state. Endothelial distribution, i.e. vessel network, allows computation of an O2 ratio in the tumour map. (C) Tumour growth simulation without irradiation. (D) Calibration of the number of cell layers authorized to divide at the tumour periphery based on growth data obtained from the literature for PC3 tumours in mice. Setting cell layers to 3 gives the best fit for these data (i.e. n = 3).
