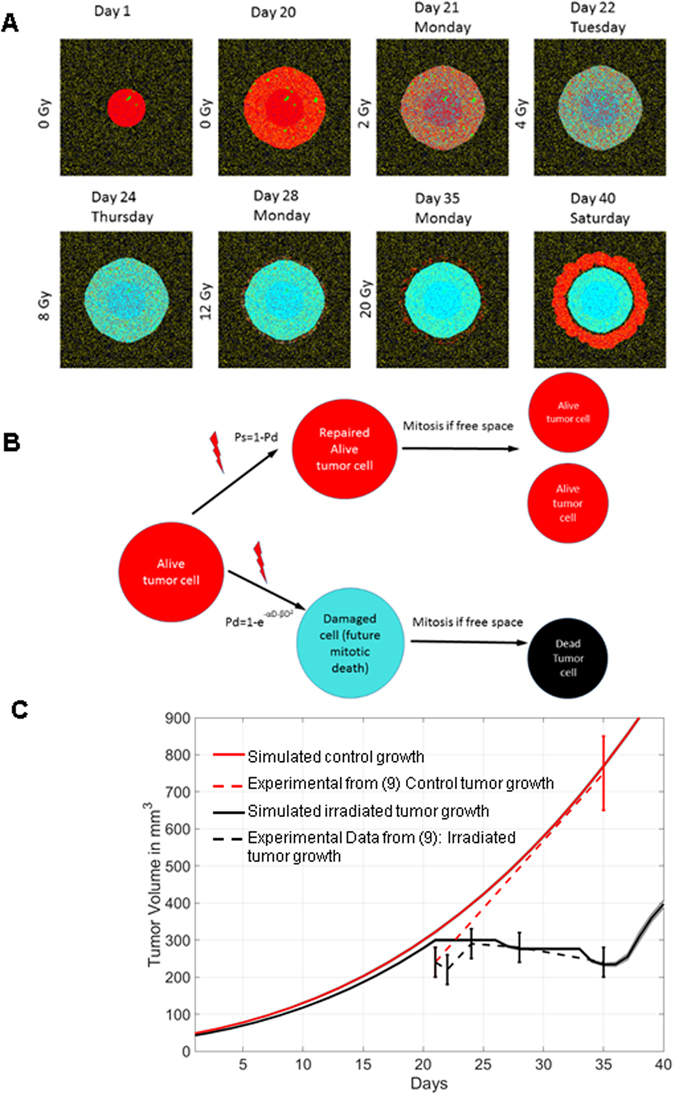
Figure 4.

Implementation of mitotic catastrophe with automata. (A) Snapshots of simulation for tumour growth being treated after 20 days of growth unchallenged by ionizing radiation. Treatment starts on day 21 and consists of 2 Gy daily for two weeks, excluding weekends. Red cells are tumour cells located in normoxic regions, green cells are tumour cells in hypoxic regions. Once treatment starts, lethally damaged cells are labeled cyan and will be removed from simulation once they reenter cell cycle (i.e. mitotic catastrophe). (B) Simple flow chart describing how cells with lethal damages are labelled using the clonogenic survival fit obtained in vitro in the context of mitotic catastrophe. (C) Comparison of experimental data5 with simulations. 10 doses of 2 Gy (black dashed line with standard deviation of measurements) vs. control growth (Red dashed line with standard deviation). Simulated tumour volume for control growth (red line, no irradiation) and for irradiated tumour (black line), simulating the same protocol (2 Gy daily except weekend for two weeks), was computed from the number of cells when exposure began at day 21 to start at the same initial volume. The volume was extrapolated from cell number by taking an approximation of a spherical tumour, and then extrapolated from the disk surface, which is about proportional to the number of cells, by applying a corrective factor (see material and methods).
