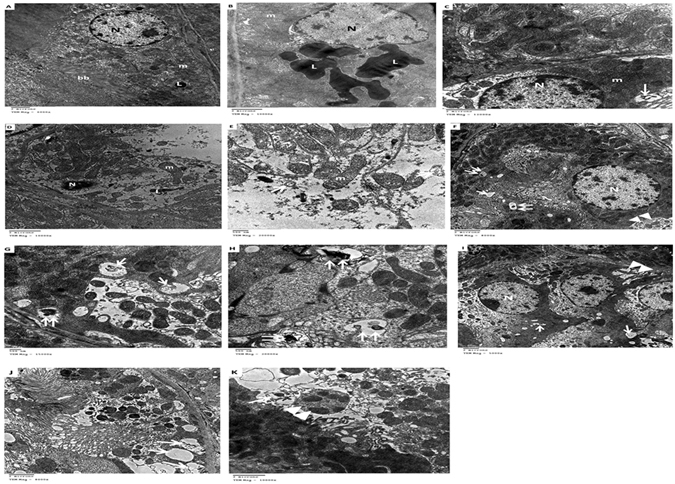
Figure 3.

Transmission electron micrograph of renal tubules. (A) Control group: Normal structures of the nucleus, mitochondria with few scattered electron-dense lysosomes and intact bruch border were noted. (B and C) diabetic rats: accumulation of huge electron-dense lysosomes and few autophagic vacuoles were detected. (D and E) diabetic nephropathy group: apoptotic nucleus, partially degraded cytoplasm and elongated mitochondria. Also, double membrane of the autophagosome was clearly seen containing cytoplasmic debris. (F–H) treated diabetic rats: cytoplasm showed multiple scattered autophagosomes, autophagosomes with lysosomes (vacuoles containing electron dense material), and mitophagy (an autophagosome containing an undigested mitochondrion), indicative of autophagic activity. (I–K) diabetic prophylactic rats: numerous autophagosomes with degenerated membrane cellular debris and mitophagy L, lysosomes; N, nucleus; bb, bruch border; m, mitochondria; [↑], autophagosomes; [↑↑], autophagosomes with lysosomes; ▴▴, mitophagy.
