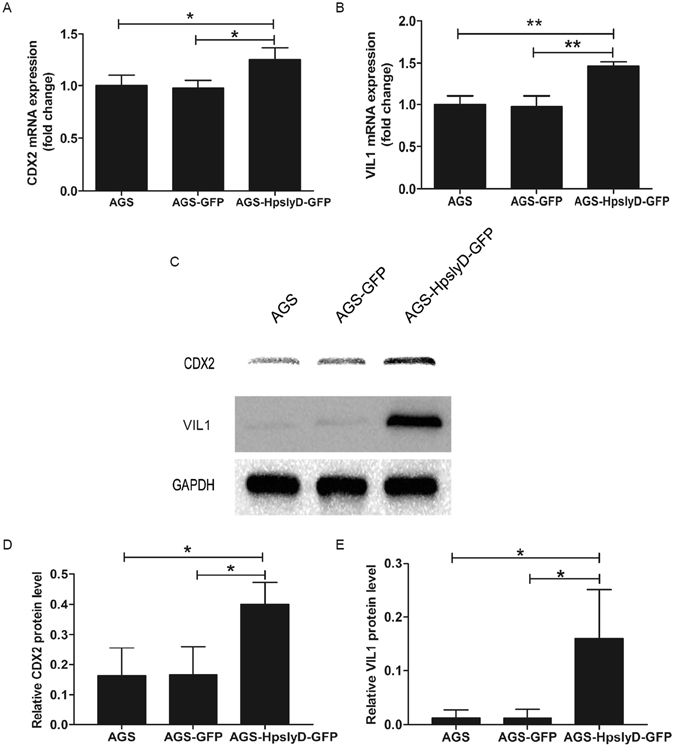
Figure 2.

Expression of HpSlyD (stable cell lines) leads to increased expression of CDX2 and VIL1 in AGS cells. (A,B) Fold increase in CDX2 (A) and VIL1 (B) mRNA expression in AGS cells and AGS cells expressing either HpSlyD-GFP or GFP alone. The values obtained with the AGS cells are referred to as 1. CDX2 and VIL1 mRNA levels are normalized to GAPDH mRNA. (C,D,E) Western blots for CDX2 (C,D) and VIL1 (C,E) expression in AGS cells and AGS cells expressing either HpSlyD-GFP or GFP alone. AGS cells were used as a control and GAPDH was used as a loading control. The results shown in (A,B,D,E) are means ± SD, each experiment performed in triplicate. *P < 0.05, **P < 0.01 as compared with AGS cells.
