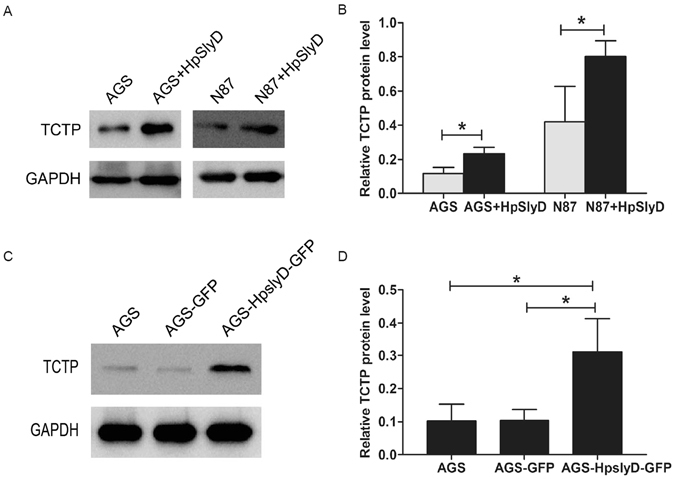
Figure 3.

Effect of HpSlyD treatment on TCTP expression. (A,B) Western blot for TCTP expression in AGS and N87 cells treated with 200 µg/ml HpSlyD for 40 hours. Non-treated cells were used as a control. (C,D) Western blot for TCTP in AGS cells and AGS cells expressing either HpSlyD-GFP or GFP alone. AGS cells were used as a control. GAPDH was used as a loading control. Results shown in (B,D) are means ± SD, each experiment performed in triplicate. *P < 0.05, as compared with AGS cells. Full-length gels are presented in Supplemental Figure 2.
