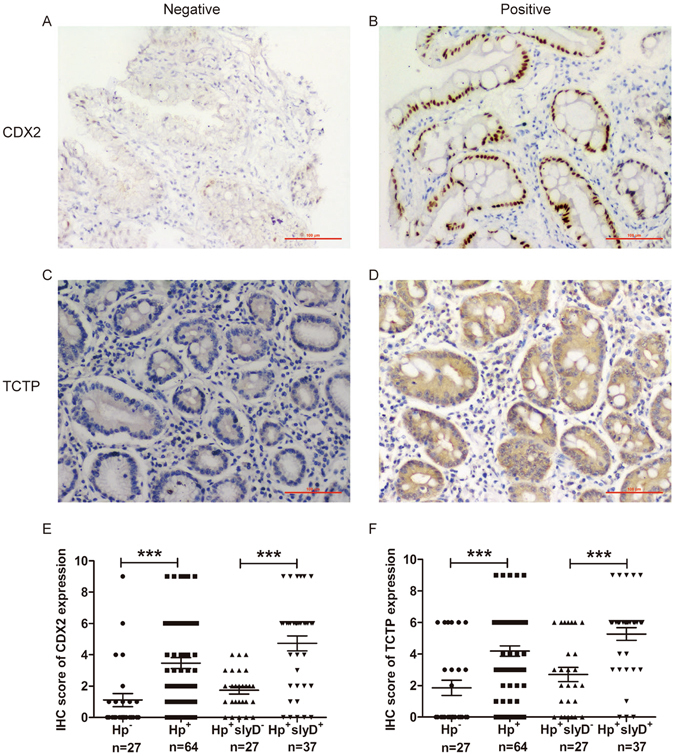
Figure 9.

IHC staining of CDX2 and TCTP in the IM of gastric mucosa. (A,B) Representative photomicrographs of IHC staining of CDX2. (C,D) Representative photomicrographs of IHC staining of TCTP. (E) Boxplot shows that CDX2 expression is significantly higher in H. pylori positive and HpslyD positive cases than in negative ones. (F) Boxplot shows that TCTP expression is significantly higher in H. pylori positive and HpslyD positive cases than in negative ones. ***P < 0.001.
