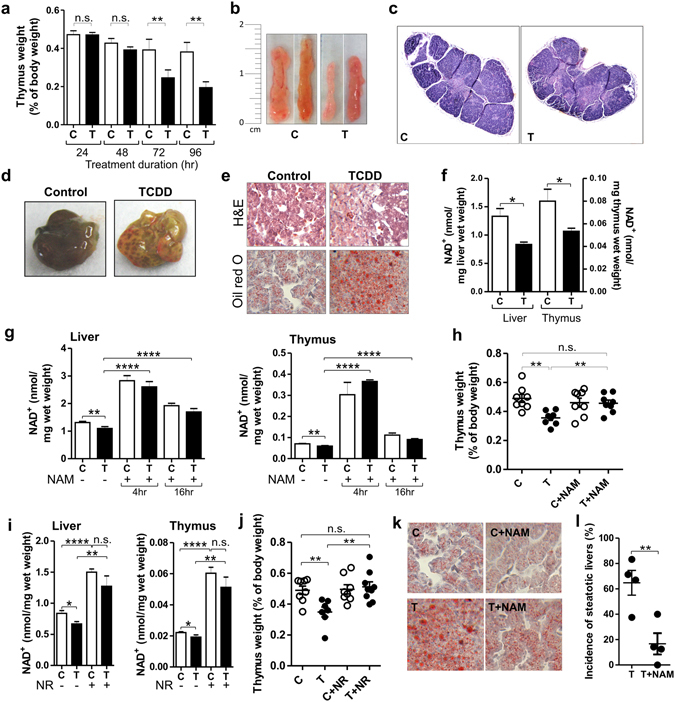
Figure 1.

TCDD produces toxic effects while decreasing NAD+ levels. Prevention by NAD+ repletion. (a) Mean thymus weights as percentages of body weight ± SE for CE treated with TCDD (T) or dioxane (vehicle control, C). For 24 and 48 hr time points, n = 8 individual embryos. For the 72 and 96 hr time points, 4 independent experiments with n = 3–8 embryos per treatment group. (b) Photographs of representative CE thymus glands. (c) Representative CE thymus sections stained with H&E. (d) Representative livers from CE treated with TCDD or vehicle. (e) H&E and Oil Red O stained liver sections. (f) NAD+ levels in livers and thymus glands. (g) Mean NAD+ levels ± SE in livers and thymus glands of CE treated for 24 hr with TCDD with or without NAM during the last 4 or 16 hr of TCDD treatment (n = 3–8 CE per treatment group). (h) Scatter plot showing thymus weights as percentages of body weight for CE treated with TCDD or vehicle with and without NAM (n = 7–8 CE per treatment group) with means ± SE for each treatment group. (i) Mean NAD+ levels ± SE for livers and thymus glands from CE treated with TCDD (24 hr) with or without nicotinamide riboside (NR) for the last 4 hr. (j) Scatter plot showing means ± SE for thymus weight for CE treated with TCDD with or without nicotinamide riboside (NR) (n = 7–9 CE per treatment group). (k) Representative Oil red O stained sections of CE livers. (l) Scatter plot for 4 independent experiments, each with n = 7–10 CE per treatment group, showing the incidence of steatosis. Control livers lacked signs of steatosis. For all Figures: *p < 0.05; **p < 0.01; ***p < 0.001; ****p < 0.0001; n.s., not significant; TCDD treatment was for 72 hr unless indicated.
