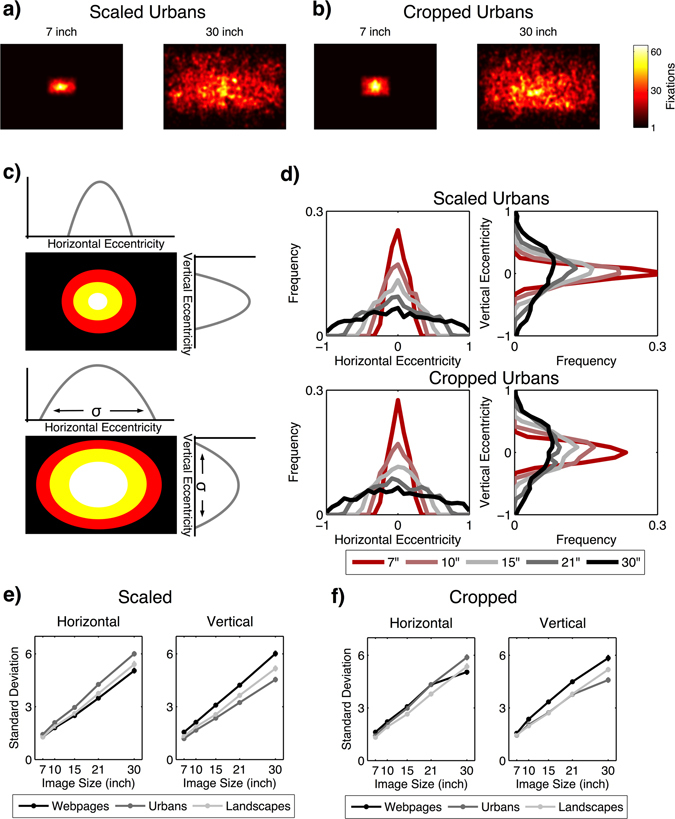
Figure 3.

The distribution of fixations in terms of a fixation density map in the two-dimensional image space for (a) urban image in the scaled condition and (b) cropped condition. (c) Sketch showing the eccentricities of the fixation distribution in horizontal and vertical directions. The extent of the eccentricity was measured by the standard deviation. (d) Eccentricities of urban images in the scaled and cropped condition in horizontal and vertical directions for all image sizes. Plots for scaled (e) and cropped (f) images indicate the extent of the eccentricities measured by the standard deviation depending on image category and image size. Error bars indicate the standard error of the mean.
