
Figure 8.
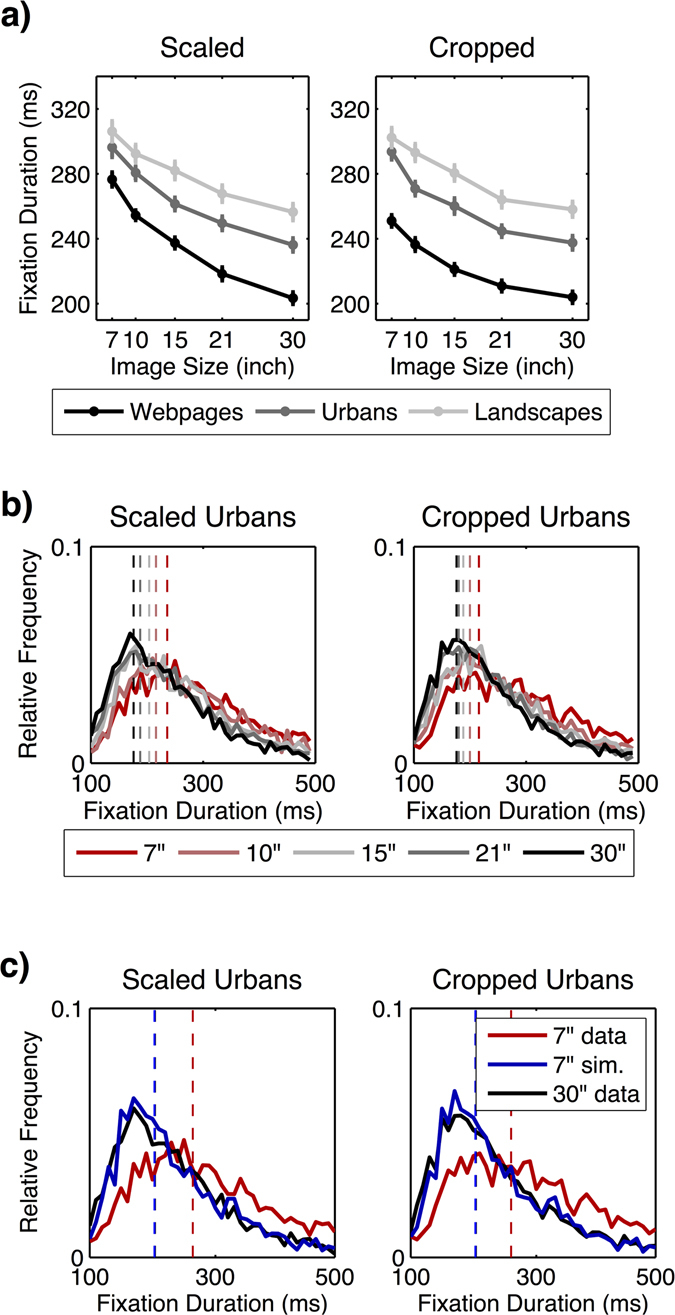
(a) Decrease of the mean fixation duration across image sizes for all image categories depending on scaled and cropped conditions. Error bars indicate the standard error of the mean. (b) Real distribution of fixation durations for urban images depending on image size and condition (scaled vs. cropped). (c) Real distribution of fixation durations on 7” and 30” images as well as the simulated distribution for 7” urban images based on fixations sampled from 30” urban images.