
Figure 1.
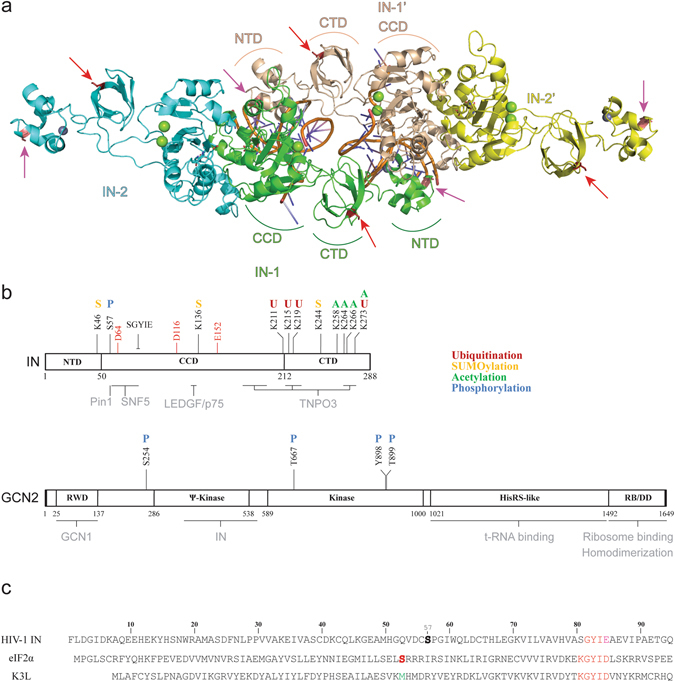
Structure of HIV-1 IN and GCN2. (a) Model of the HIV-1 intasome structure. A tetramer of IN is represented as cartoon colored by subunits, with 2 viral DNA ends colored by element. The magnesium and zinc ions are represented as green and grey spheres, respectively. The full-length structure of monomers derives from the model published by Johnson et al.14. The catalytic and structural monomers are indicated as IN-1/IN-1′ and IN-2/IN-2′, respectively. (b) Schematic organization of HIV IN (top) and human GCN2 (bottom). Regions known to participate in cofactor binding are highlighted in grey below the scheme. Post-translational modifications that have been described in the literature are reported above the scheme and color coded. The IN catalytic triad DDE is highlighted in red. (c) Alignment of the N-terminal sequence of HIV-1 IN, human eIF2α and of the vaccinia virus protein K3L.