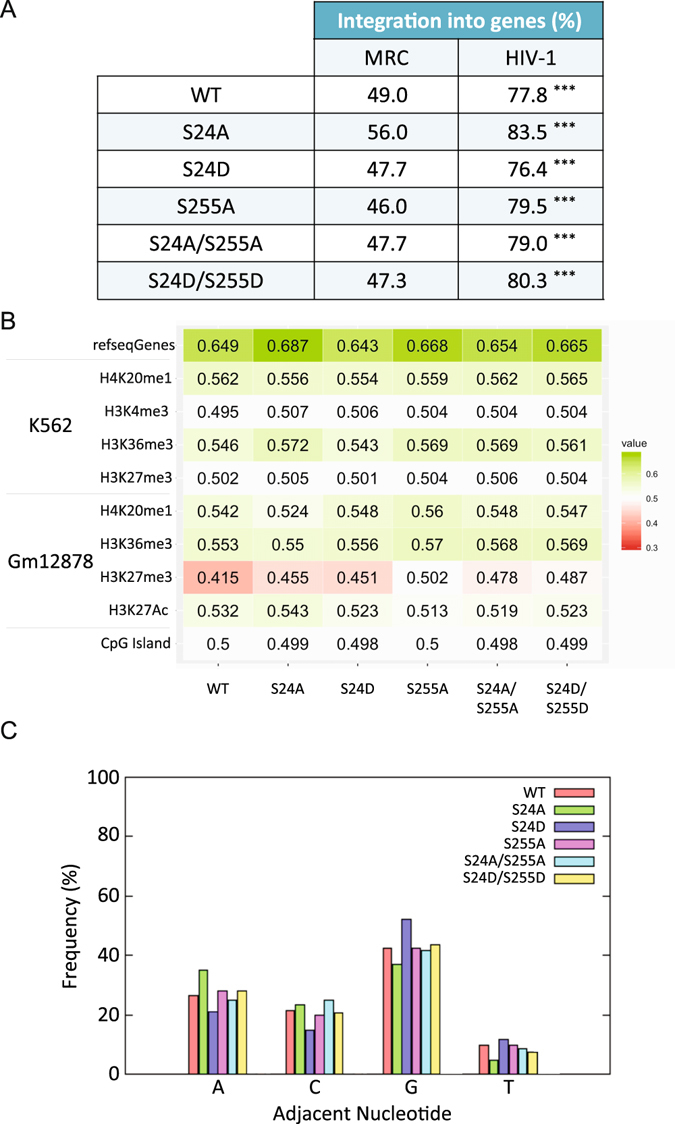
Figure 7.

Effect of phosphomutants on integration site selection and specificity. (a) Frequency of integration into genes. Stars represent the p-values (***p < 0.001) after comparison of experimental results with matched random control. (b) Heatmap of integration site datasets. For a given integration site dataset, all calculated rank values are averaged. Values between 0 and 0.5: the genomic feature appears less frequently at/near integration sites than at/near random sites in the genome and is disfavored. Values between 0.5 and 1: the genomic feature is enriched at integration sites. Values of exactly 0.5 indicate that integration sites are neither enriched nor depleted with respect to the feature of interest. (c) Frequency of occurrence of each nucleotide at the integration site.
