
Figure 3.
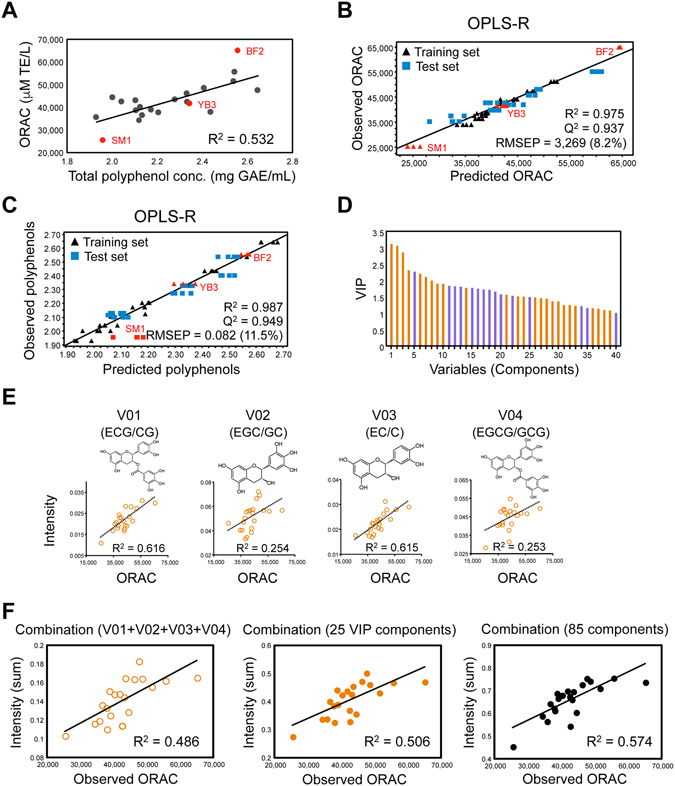
Construction of bioactivity-prediction model to predict the anti-oxidant activity of GTEs based on their composition profiles. (A) Correlation between ORAC and total polyphenol content. ORAC values are presented as Trolox equivalents (TE). Total polyphenol contents are presented as gallic acid equivalents (GAE). Models for predicting (B) ORAC or (C) total polyphenol content were calculated from the MALDI–MS datasets of 21 GTEs, including 13 training (black triangles) and 8 test (blue squares) sets. (D) Bar chart showing the influence of variables used to create the ORAC-prediction model for GTEs (Y-axis is the value of variable-importance-in-projection, VIP). Forty variables with large VIP values (>1) were extracted. Orange bars indicate positive correlations between the intensity of the component and ORAC. Purple bars indicate negative correlations. (E) Correlations between ORAC and the intensity of each of the top-4 components with the largest VIP values (>1). (F) Correlations between ORAC and the summed abundances of multiple components. Left panel: combination of the above-mentioned top-4-VIP components. Middle panel: combination of the 25 positively correlated components with the largest VIP values (>1). Right panel: combination of all 85 positively correlated components from among the 149 total components.