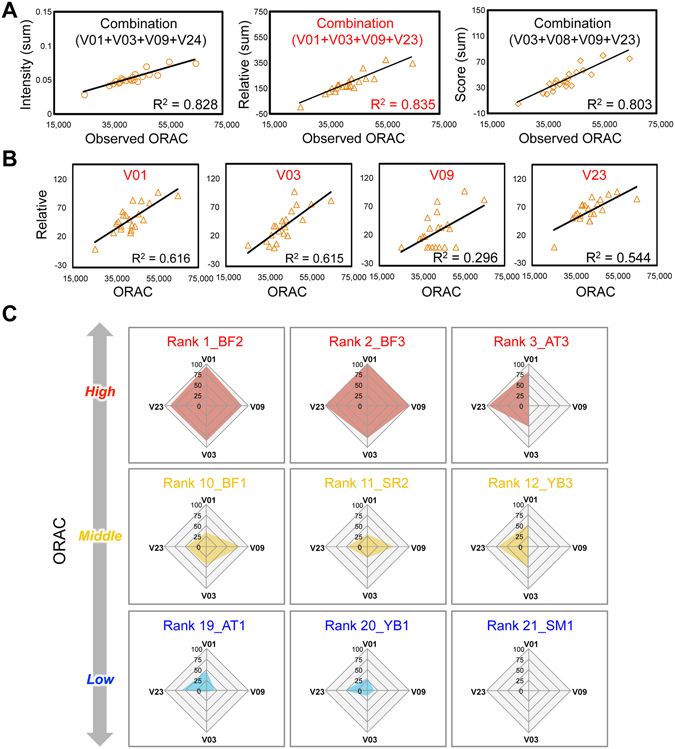
Figure 4.

Chemometrics-driven selection of bioactivity-correlated chemical combination in GTEs and visualization of observed ORAC values using the selected combination. (A) The highest correlation was found between observed ORAC value and the summed abundance (Intensity) of 4 components as a bioactivity-predictive combination. Correlations based on the relative value (Relative; Maximum: 100, Minimum: 1) and ranked scored value (Score; Top: 21, Bottom: 1) of the summed abundance are also shown. (B) Correlation of Relative value of each individual component with ORAC. (C) Observed ORAC values of GTEs visualized as radar charts using information from the 4 selected components. Selected representative charts of the GTEs are shown, demonstrating that ORAC can be visually estimated from the 4 component abundances.
