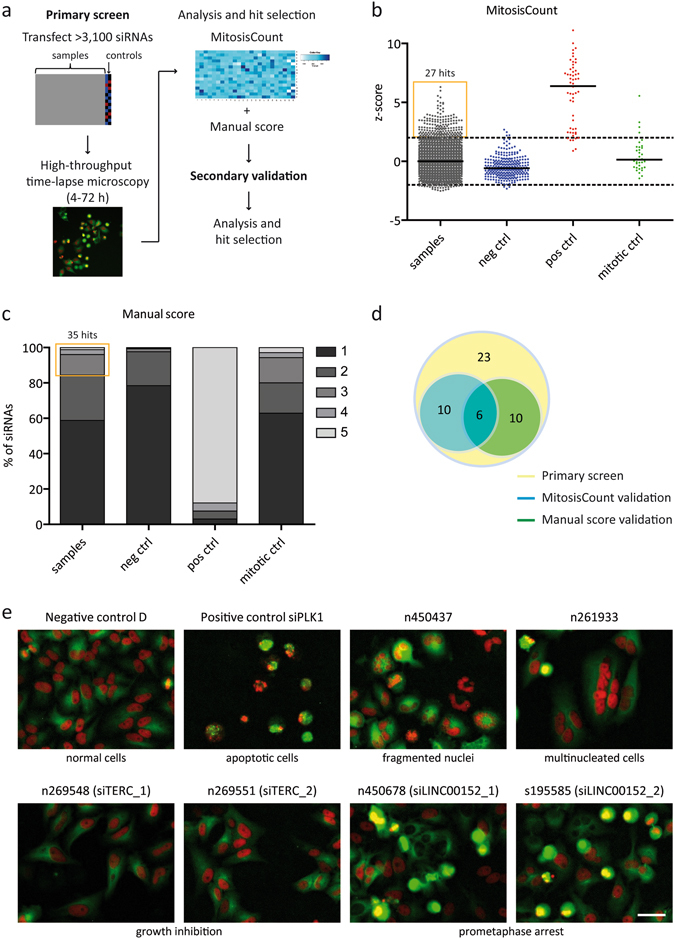
Figure 1.

High-throughput RNA interference screen for cell cycle regulators. (a) Schematic overview of the siRNA screening strategy. (b) Bioinformatical analysis was performed by calculating the z-scores for MitosisCount. Black lines represent the median of z-scores. Dashed lines indicate the cut-off for potential phenotypes. (c) Manual analysis was accomplished by assigning a manual score representing the strength of any kind of aberrant phenotype. 1 = normal; 5 = strong phenotype. (d) Venn diagram of hits from the primary screen and secondary validation. (e) Image sections of exemplary phenotypes discovered by time-lapse microscopy (red: histone H2B, green: tubulin). The siRNA IDs are stated above the images, phenotypes are described below the images. Images were acquired at 10x magnification. Scale bar represents 100 μm.
