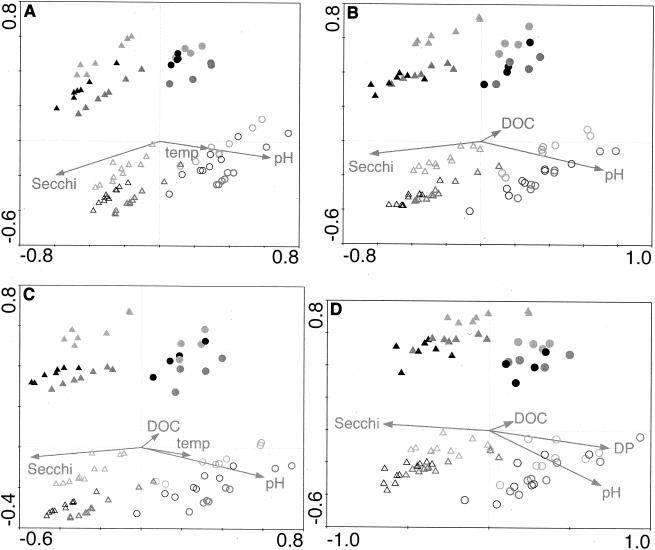
FIG. 5.
CCA biplots for presence-absence-transformed lake ARISA data. Points represent ARISA profiles, and the symbols indicate the values of qualitative variables from the models (Table 3): region (northern lakes, triangles; southern lakes, circles); LP (drainage lakes, open symbols; seepage lakes, filled symbols); month (May, light gray; July, dark gray; October, black). Arrows for quantitative variables show the direction of increase of each variable, and the length of the arrow indicates the degree of correlation with the ordination axes. Secchi, Secchi depth; temp, water temperature. CCA defined ARISA profiles with sensitivity levels of 50 (A), 100 (B), 150 (C), and 200 FU (D) to define the minimum size of analyzed ARISA peaks.

