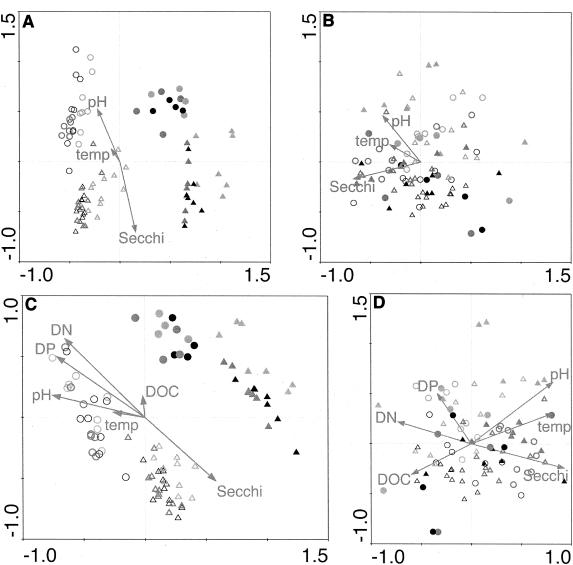
FIG. 6.
CCA biplots for semiquantitative and quantitative lake ARISA data. Points represent ARISA profiles, and symbols indicate the values of qualitative variables from the models (Table 3): region (northern lakes, triangles; southern lakes, circles); LP (drainage lakes, open symbols; seepage lakes, filled symbols); and month (May, light gray; July, dark gray; October, black). Arrows for quantitative variables show the direction of increase of each variable, and the length of the arrow indicates the degree of correlation with the ordination axes. Secchi, Secchi depth; temp, water temperature. A 150-FU sensitivity level was used to define the minimum size of ARISA fragments included in the analyses. (A) CCA for semiquantitative ARISA profile analysis. (B) Partial CCA for semiquantitative analysis. Here the effects of region and LP have been removed by including them as covariables in the model. (C) CCA for quantitative ARISA profile analysis. (D) Partial CCA for quantitative analysis (covariables are region and LP).

