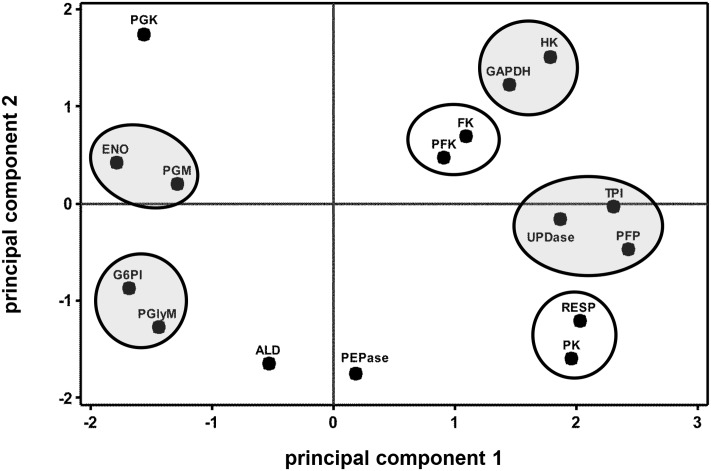
FIGURE 3.
Principal component analysis (PCA) score plot of the changes in glycolytic enzyme activities and respiration rate (RESP) during 60 days storage. Ovals identify groups of metabolites that exhibit similarities in storage-related concentration changes. Ovals are gray where metabolites share similar changes in concentration, but have no obvious connection with each other. Roots were stored 10 days at 10°C and 90 ± 5% RH, then stored at 4°C, 90 ± 5% RH for an additional 50 days. Principal components 1 and 2 account for 41 and 21%, respectively, of the variance in the data after standardization. Abbreviations used for enzymes are defined in Table 1. PCA loading plot is available in Supplementary Figure S1.

