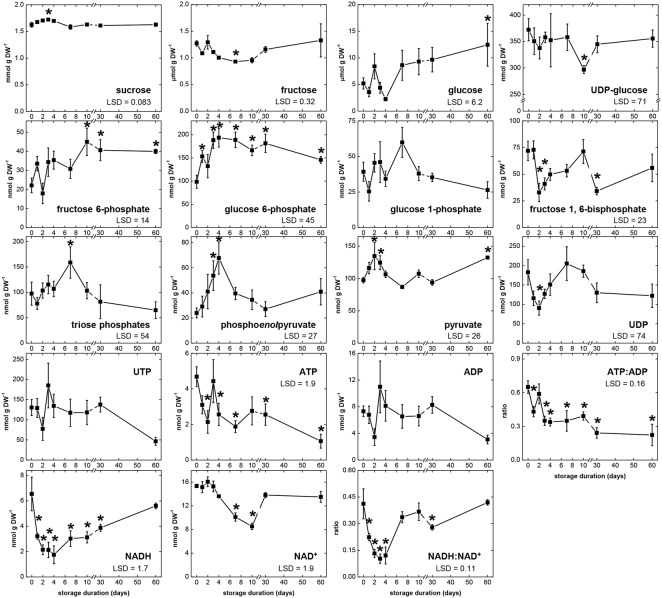
FIGURE 4.
Concentrations of glycolytic pathway metabolites, ATP:ADP ratio, and NADH:NAD+ ratio during 60 days storage. Roots were stored for 10 days at 10°C and 90 ± 5% RH, then stored at 4°C, 90 ± 5% RH for 50 days. Concentrations are expressed per gram dry weight. ATP:ADP ratio is provided as a measure of cellular energy status. NADH:NAD+ ratio is provided as a measure of cellular redox status. Error bars are ±1 standard error of the mean, where n = 7. Fisher’s LSDs are provided in lower left corner of graphs with α = 0.05. Asterisks denote data that are significantly different from that at 0 days.

