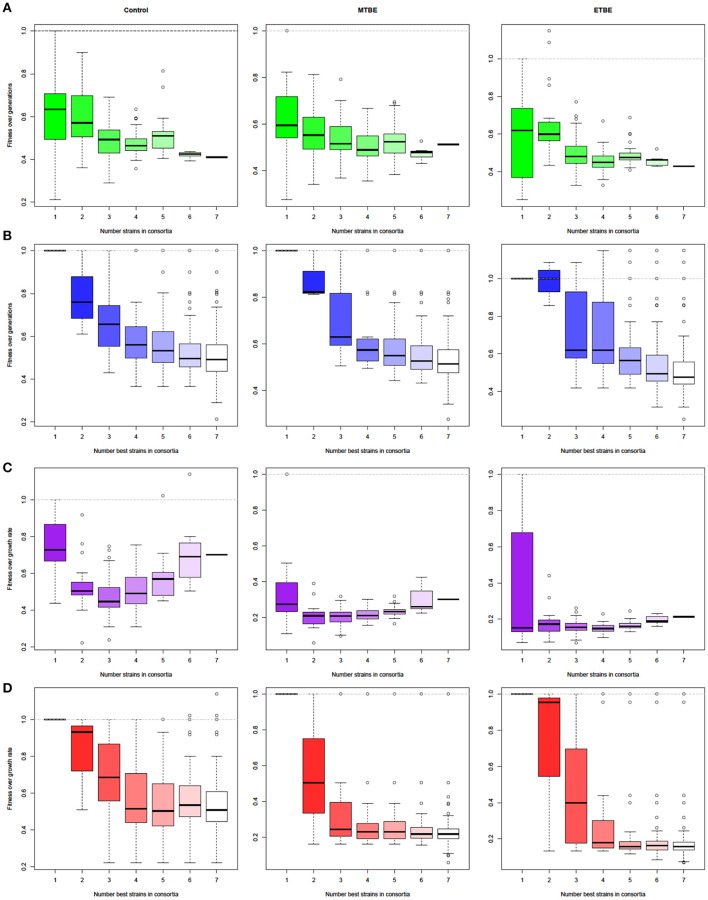
Figure 4.
Effect of increasing species richness on fitness. General decrease in fitness is observed with increasing species richness (A,C). Data points were normalized by the fittest species (non-cumulative analysis). Panels (B) and (D) show how many fittest species (No. of best strains) are needed to obtain the fittest combination, where any data point >1 is better than the fittest individual strain. Data points were normalized by the fittest species, adding each species (previously ordered from fittest to weakest, 1 → 7) and all combinations cumulatively. No. generations (A,B) or growth rate (C,D) data were used. The box's height spans between the interquartile range (IQR, 25th and 75th percentiles), and whiskers extend to 1.5-fold the IQR. Outliers beyond the whiskers are plotted as open circles.

