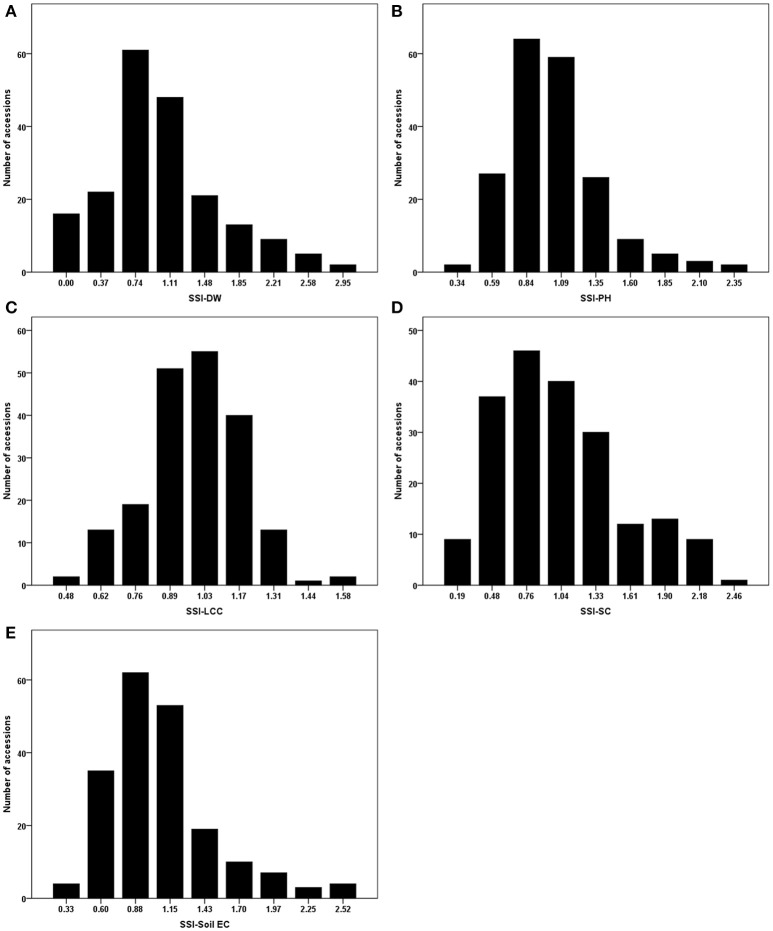
Figure 1.
Phenotypic evaluations of stress susceptibility indexes (SSI) for measured traits. (A) SSI-DW, SSI for dry weight; (B) SSI-PH, SSI for plant height; (C) SSI-LCC, SSI for leaf relative chlorophyll content; (D) SSI-SC, SSI for stomatal conductance; (E) SSI-Soil EC, SSI for soil electrical conductivity.

