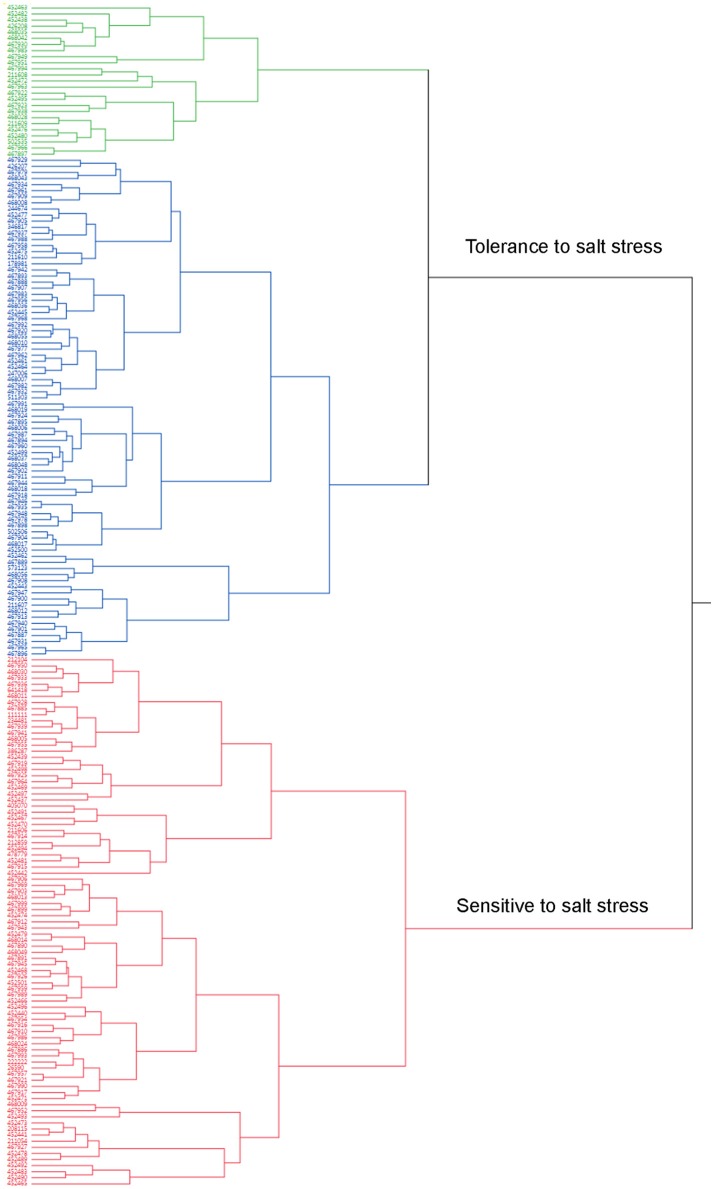
Figure 2.
Dendrogram of phenotypic variations of salt tolerance in 198 accessions. Mean values of all traits evaluated in the present study were used for cluster analysis using the hierarchical cluster program built in the JMP13 software (SAS, Cary, NC). Accessions (PIs) were clustered into 2 clusters based on their responses to salt stress (Table S1). Cluster 1 contains 114 accessions (Blue and green colors) with resistant (Green colored) or moderate resistance (Blue) to salt stress. Cluster 2 contains 85 accessions (Red color) and most of them are sensitive to salt stress.

