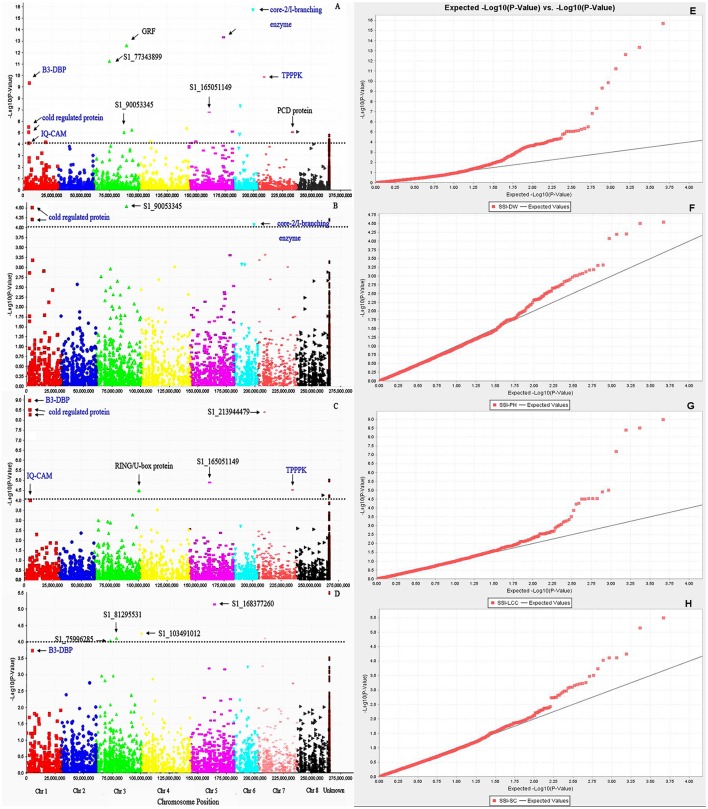
Figure 3.
Manhattan plots of marker –trait association for salt tolerance traits: (A) SSI-DW, (B) SSI-LCC, (C) SSI-PH, (D) SSI-SC. Significant markers passed a cutoff –log (P-value) of 4 were above the dot lines. Putative candidate genes linked to significant markers were labeled and those identified in multiple traits were highlighted by blue color. (E–H) represent quantile-quantile (Q-Q) plots from GWAS of SSI-DW, SSI-LCC, SSI-PH, and SSI-SC, respectively. The color curves represent observed p-values (log transformed negatives) of marker-trait association. The black line represents expected p-values.

